In last week’s column I continued the discussion of GuySuCo’s performance indicators and also dealt with several other items related to the pattern of yields of sugar cane on GuySuCo’s estates. I should point out, as it is not generally appreciated that the Guyana Sugar Corporation Limited (GuySuCo), while incorporated in February 1976 “to cultivate sugar cane and manufacture and sell sugar and molasses,” has continued under the Companies Act of 1991 as the Guyana Sugar Corporation Inc, established on February 28, 1996. It continues, however, to be wholly owned by the Government of Guyana. Further, it should be noted that, although it has an effective monopoly of sugar processing (through its ownership of all the factories in the industry), there remains about eight per cent of the sugar cane cultivation in Guyana, which comes from independent private cane farmers. The data which I cited last week, therefore, are based solely on the performance of the GuySuCo sugar estates.
 To the best of my knowledge GuySuCo possesses about 21,565 hectares of freehold land and leases about 55,173 hectares from the Government of Guyana. The tenure of the leases is generally for 50 years and as far as I am aware the corporation believes there is no intent by the Government of Guyana to pass title to the corporation for any of these lands. As such the corporation reports in its financial statements its land holdings as “classified leases in accordance with IAS 17” (GuySuCo Annual Report 2009).
The weak performance of sugar cane yields in recent years, which was noted last week reflects a range of considerations, which the corporation’s turnaround plan has sought to address. These include, but are not limited to i) the weak organization and management of all the crucial agricultural areas of sugar cane cultivation (land selection; tillage; land preparation; planting; ratooning and replanting; monitoring of plant development, and so on); ii) the relative neglect of Research and Development (R&D), including in the areas of plant varieties, soil management, pests and diseases control, land preparation, and selection, training and the efficient use of farming equipment; iii) the increasing problems facing water management on the estates, especially drainage and irrigation; iv) the haemorrhaging of farming skills, which continues because of relatively poor pay and conditions of service; and v) the cascading effects of environmental damage.
In GuySuCo’s review of its Strategic Plan for 1998-2008 the corporation refers to its Rehabilitation Programme designed to counter the agricultural decline. This plan did have an immediate impact leading to a rise in the yield of cane per hectare in 1999, but as we saw in last week’s column this was quickly reversed in 2000, and indeed yields continued to fall until 2002.
Factory performance
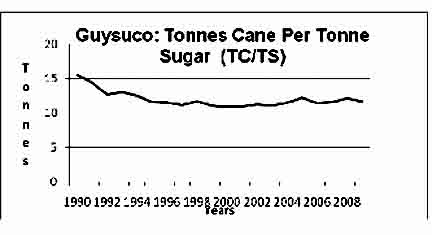
 I turn next to GuySuCo’s factory performance for the decades of the 1990s and 2000s. These data are summarized and presented below in the table and graph for readers’ convenience. These data show a much narrower range in annual performance than in the case of sugar cane yields. In the 1990s the range was from 15.54 tonnes cane per tonne sugar to 11.10 tonnes cane in 1999; while in the 2000s the range was from 10.88 tonnes in 2000 to 12.20 tonnes cane per tonne sugar.
GuySuCo: Tonnes Cane Per Tonne Sugar (TC/TS)
1990s TC/TS 2000s TC/TS
1990 15.54 2000 10.88
1991 14.36 2001 11.00
1992 12.68 2002 11.2
1993 13.07 2003 11.03
1994 12.47 2004 11.52
1995 11.64 2005 12.2
1996 11.51 2006 11.46
1997 11.12 2007 11.56
1998 11.68 2008 12.16
1999 11.10 2009 11.67
Arithmetic Arithmetic
Mean 12.52 Mean 11.47
Mean Mean
Absolute Absolute
Deviation 1.11 Deviation 0.35
Source: GuySuCo’s Annual Reports.
On the whole the data reveal that there has been little difference in average yields for the1990s and 2000s, there being in fact a slight improvement from 12.52 tonnes cane required in the 1990s to a reduced total of 11.47 tonnes cane in the 2000s per tonne sugar. The data for the mean absolute deviation shown in the table for the two decades support this observation. The mean absolute deviation in the 1990s was 1.11 and for the 2000s it was lower at 0.35. Again, this is in striking contrast to what the data on sugar cane yields as a performance indicator for GuySuCo revealed in last week’s column.
The data covering both decades are shown in the graph below. Here the improvement in factory performance over the two decades is more clearly revealed.
The improvement in factory performance during the two decades from a peak of 15.54 tonnes cane per tonne sugar is very apparent. To repeat, this is in stark contrast to sugar cane yields as a performance indicator for the agricultural sector.
Next week I will conclude the examination of performance indicators for GuySuCo, as I combine the data for the agricultural performance with that for factory performance for the decades of the 1990s and 2000s.