Introduction
The mindset of five major groups of stakeholders to the tax reform process (individual taxpayers; the law-making authorities; the public at large as beneficiaries of government spending; the tax administration authorities; corporate and other business taxpayers; as well as organisations like unions, farmers’ organisations, consumer groups and professional associations interested in greater transparency, fairness and efficiency in the tax system) have been briefly described in my two previous columns.
It should be further noted here that two principal considerations may have encouraged the previous government’s boast that ongoing tax reform since 2003 has been “a tremendous success.” When this claim was made the administration had highlighted 1) administrative improvements in tax collections, and 2) strong annual growth in tax revenue (in excess of 13 per cent annually since 2003).
 Next week I shall consider whether these two considerations justify the pronouncement of success, as this directly relates to the question: what are the goals of tax reform? Before treating with this, readers should have some knowledge of 1) total tax revenue collected; 2) its relation to total output; 3) the contributions made by various taxes to this total; and 4) tax revenues collected in Guyana compared with other countries. I shall attempt this in today’s column.
Tax revenue by type
While the available classification of Guyana’s tax revenue by type is not ideal for economic analysis, what has been reported is adequate for our present purposes. As shown in Table 1 total tax revenue collected in 2010 was $102 billion. Unlike more developed economies, the share of taxes on goods and services of all kinds clearly predominate, as this represents over 60 per cent of the total. When these revenues are disaggregated, however, it is seen that the bulk comes from two sources: Value Added Taxes (27 per cent) and excise taxes (21 per cent) of the total.
In 2010, taxes on income constituted the second main pillar, at 39 per cent of the total. When further disaggregated the resultant shares are 21 per cent for taxes on business; 15 per cent on personal taxes; and 2 per cent came from taxes collected from the self-employed.
Based on the available classification, tax revenue from international trade and international transactions was equal to ten per cent of the total. The main sub-categories are imports at eight per cent, and travel tax ($1 billion or one per cent). If, however, Value Added Taxes on imported items, 15 per cent (as against domestic supplies at 12 per cent) are added to excise taxes on imported items, 19 per cent (as against domestic supplies at 2 per cent) we get the grand sum of 42 per cent for import-based tax revenue.
Table 1: Guyana: Distribution of Tax Revenue, 2010

Note: *figures rounded.
Source: Government of Guyana, Estimates Vol. 1, 2011.
A few observations are pertinent at this stage. First, the data in Table 1 reveal how little the self-employed contributed to tax revenue ($2 billion, out of a total of $102 billion) in 2010. Second, because total tax revenue collected is close to $100 billion, the absolute value of tax revenues raised by each type of tax approximates its percentage share of the total.
Thirdly, taxes on property (including estate duties) also contributed marginally, at 2 per cent of total tax revenue. Fourthly, total tax revenue as a ratio of rebased GDP (at current basic prices) for 2010 was equal to 26 per cent.
And, finally total tax revenue in 2010 increased by 13 per cent over 2009 ― the same as government’s average rate previously indicated for the period since 2003.
Drawing comparisons
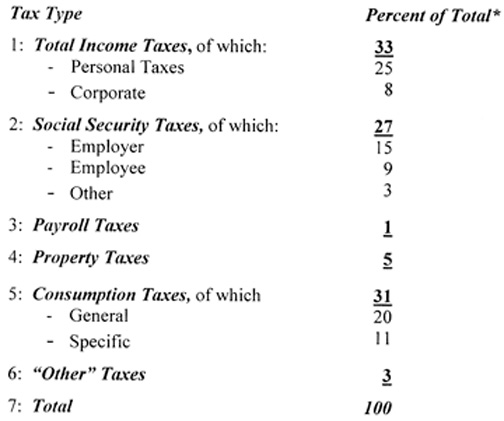
For readers benefit, Table 2 below shows the unweighted average distribution of tax revenue by type for the 34 member states of the Organisation for Economic Cooperation and Development (OECD).
The ratio of their total tax revenue to GDP is 34 per cent, as compared to Guyana’s 26 per cent. The range, however, is quite wide, from 19 per cent (Mexico) to 46 per cent (Sweden). Seven OECD countries have a ratio of 42 per cent or over, while two have a ratio of 21 per cent or lower. Further, five OECD countries have Guyana’s ratio of 26 per cent or less.
Table 2: Distribution of Tax Revenue in OECD countries, 2009

Source: OECD Website and Eurostat (2011).
Two cautionary observations are warranted. Firstly, the difference in the total tax revenue/GDP ratio between Guyana and the OECD reflects different economic structures. Secondly, apart from structural differences contributing to the different ratios, different incremental trends in economic growth rates and tax revenue elasticity can also result in variations in the tax revenue/GDP ratios. Thus when growth rates rise faster than tax revenue yield, the ratio would fall, and vice versa. That is, if tax responsiveness is rising at a faster rate than GDP, the ratio would rise.
Next week I shall continue from this point and seek to address the question: what ought to be the primary goals of tax reform?