This week’s column wraps up my presentation on the long-term situation of the global sugar industry, which as I have argued stands in stark contrast to that of Guyana’s. I shall concentrate today’s discussion on global consumption and the world market price for raw sugar.
Global consumption
Like global output, world consumption of sugar (and other sweeteners) has also enjoyed a period of vigorous expansion. Overall, the growth in global demand has been largely a function of population growth, rising global incomes, and tastes or preferences. Despite the emergence of competitors to sugar, global demand for it has grown at more or less the same respectable annual rate of 2-3.5 per cent as sugar output. Per capita consumption of sugar today is four to five times greater than it was at the beginning of the 20th century.
Over the years a couple of features have stood out. One is that while the growth in consumption and output is vigorous and worldwide, Asia and Africa are the major deficit regions where their output does not balance their demand. The other feature is that India is the largest consumer of sugar, and this consumption is mainly based on its domestic production.
Table 1 below shows the world sugar balance for the period since the global crisis (2008-09 to 2013-14). The table shows an increase in global output of 31 million tonnes and consumption of 14 million tonnes over the period. Ending stocks for the period have averaged 33.5 million metric tonnes or about one-fifth of global consumption. Further, projections of the world’s sugar market for the next decade expect prices to plateau at around 20 cents per lb.

Volatile world sugar prices
Over the past half century the world free market price for sugar has been very volatile. This is attributable to 1) the fact that the bulk of export sugar has been sold in regulated markets; the free market for sugar is called a residual or surplus market, where only unregulated raw sugar is sold; 2) the seasonality of sugar production, which causes mismatches in demand and supply; 3) volatile prices of sugar-related commodities, like oil; 4) governmental intervention in the sugar trade by the main importers; and 5) fluctuating exchange rates.
For the years 1960 to 2013 the volatility of nominal sugar prices is revealed in Table 2 and its accompanying graph.
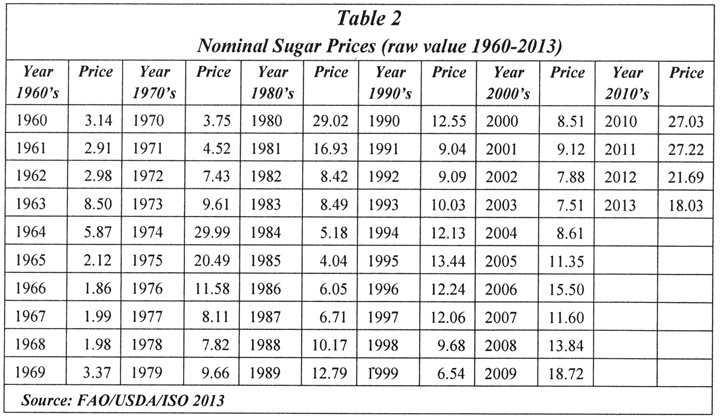
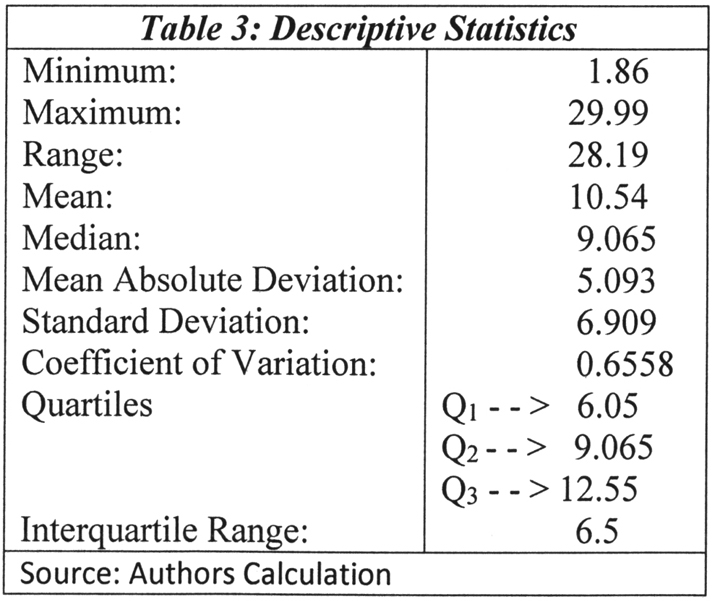
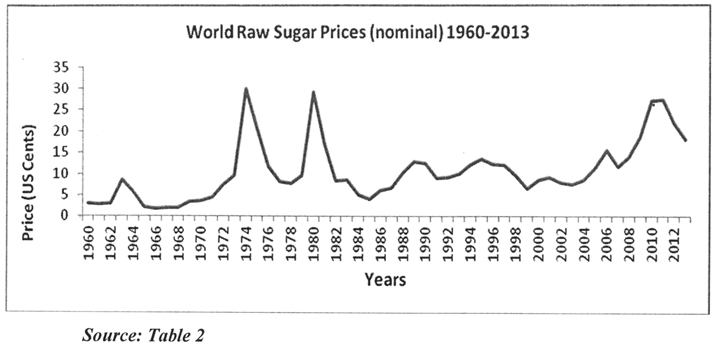 The average annual nominal price has ranged from 1.86 cents per lb (minimum) to 29.99 cents (maximum). The range is therefore 28.13 cents per lb. Three peak periods, where the average price has exceeded 20 cents per lb are: 1974-75; 1980; and, 2010-12. The average or mean price per lb over the period 1960-2013 is 10.54 cents and the median price is 9.065 cents. The price variation is captured in the following measures: standard deviation (6.909); mean absolute deviation (5.093) and coefficient of deviation (0.6558). For convenience the quartiles are Q1 – – > 6.05; Q2 – – >; 9.065 and Q3 – – >; 12.55. The inter-quartile range (IQR) is therefore 6.5. For the convenience of readers these descriptive statistics are shown in Table 3 below:
Descriptive Statistics: World Nominal Sugar Prices (raw value, cents per lb)
Conclusion: The final straw
Only marginal quantities of Guyana’s sugar exports have been sold on the world market. About 85 per cent of its sales have been made to the regulated markets of Britain and Europe and to a much lesser extent the United States (5 per cent). The remainder of its exports is sold to Caricom countries. Beginning with the Commonwealth Sugar Agreement created by Britain in 1951 to secure its sugar supplies in a period of feared commodity shortages; Britain’s entry into the European Community (EC) morphed the CSA into the EC – African, Caribbean and Pacific (ACP) group of countries, Sugar Protocol (SP) in 1975.
Next week I shall discuss these arrangements further as many analysts have reasoned that the EC’s denunciation of the SP in 2009 has been the straw that broke the camel’s back or the final nail in the coffin of Guyana (and Caricom’s) sugar industry. Beginning with St Kitts and Nevis, the ending of the SP has brought drastic changes to the sugar industries of Barbados, Belize, Jamaica, and Trinidad and Tobago.