Indicators
Despite the unavailability of detailed audited GuySuCo accounts after 2009, in the coming weeks I shall focus on six performance indicators (production, costs, profitability, land productivity, factory productivity, and combined (land and factory) productivity) in assessing the sugar industry since 1990. I believe this period is sufficient for clear patterns to be revealed.
The time series on production reveal both trends and variations or fluctuations in output over time. I shall, however, present the annual data as three-year averages both for ease of presentation and in an effort to smooth annual output fluctuations/variations occasioned by weather and other unforeseen occurrences impacting on cultivation and harvesting, since sugar is processed from an agricultural crop (cane).
 The data on costs are standard, that is offering a summary presentation of 1) unit cost of production; 2) the major components of unit costs; 3) cost comparisons across estates; and 4) employment costs as a separate special variable. Arrears in these corporation costs would be reflected in its liabilities (current and long-term).
The profitability data would reveal the intrinsic sustainability of the industry’s operations, as it shows its ability to cover 1) full costs (including labour, depreciation of the capital stock, meeting its debt obligations; 2) future investments; and 3) provide adequate returns to its shareholders.
Land productivity data are determined by the tonnes cane produced per unit (hectare) of utilized agricultural land over time. Factory productivity data are determined by the tonnes of cane required to produce a tonne of sugar over time. And, the combined productivity data (land and labour) are expressed as tonnes of raw sugar (the final product) produced by one unit of agricultural land (usually expressed as a hectare).
The schedule below, adapted from an earlier SN column (October 2, 2012) summarizes this information. I should observe here, however, that, while the indicators cited are not intended to be exhaustive, when taken together they provide quite a useful indication of the current viability of GuySuCo.
Schedule: Selected Sugar Performance Indicators
Indicator Measure Comment
Annual Production Application of selected Available from
descriptive statistics official sources
Profitability As indicated in Guysuco Limited availability
accounts (audited and of audited data after 2009
unaudited)
Cost Unit (US cents/lb), of As provided by Guysuco
which administration,
central and factory
Agricultural Land Tonnes cane per hectare As provided by Guysuco
Productivity
Factory Productivity Tonnes cane per tonne sugar As provided by Guysuco
Combined Tonnes sugar per hectare of As provided by Guysuco
Productivity cultivated land
(factory and land)
Performance indicators I
For industry observers, the most revealing indicator would be annual sugar production over the past several decades. Such information captures both the long-term trend in output and the variability/fluctuation in production over time. These data are presented in Table I below. As indicated above the table presents the data based on 3-year averages, so that it modulates some of the output variability.
Table 1: Guyana: Output of Sugar in ‘000 tonnes:
1961-2013 (three-year average)
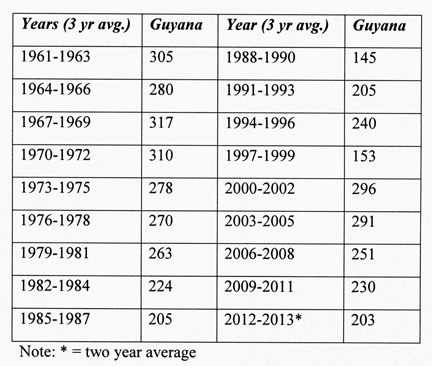
Note: * = two year average
Sources: FAOSTAT, Guysuco Annual Reports
Thomas, C Y, (2005)
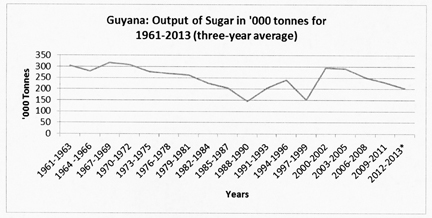
The overall trend in the data shows clearly that, over the past fifty years, production has been declining. From an average output of more than 300 thousand tonnes in the 1960s up to the early 1970s (where it averaged 294 thousand tonnes for 1970-75); the decline more or less started thereafter, except for the respite in 2000-2005 (when it regained the early 1970s level). The steepest declines have occurred during 1988-90 (145 thousand tonnes) 1997-1999 (153 thousand tonnes) and 2012-2013 where it has averaged only 203 thousand tonnes.
The average output for the latest period (2012-13) is only about two-thirds of that produced decades ago (in 1961-63, when the series started!) The graph below reveals these patterns more sharply.
I have subjected the production data to an analysis of their descriptive statistics in order to portray their measures of 1) spread, variability or dispersion, and 2) central tendency or the typical values in the dataset. Selected results from this analysis are shown in Table 2 below. The variability/spread/dispersion in the output series is considerable. Production has fluctuated from a minimum of 145 thousand tonnes for 1988-1990 to a maximum of 317 thousand tonnes for 1967-1969. The range in output (172 thousand tonnes) is considerable, larger than the minimum output!
The mean absolute deviation is 42 and the standard deviation is 51. The coefficient of variation, (the standard deviation divided by the mean) is 0.2; and the relative standard deviation is therefore 20 per cent. The variance in the production data is 2645.
The simple average or arithmetic mean of the dataset is 248 thousand tonnes. This was less than the median output (257 thousand tonnes), which is that output where there are as many higher values above it as there are ones below it. With only two similar values, the mode is 205 thousand tonnes, which is not a particularly useful indicator in this instance.
Table 2
Production: Selected Descriptive Statistics
Descriptive Statistic Value
Minimum 145
Maximum 317
Range 172
Mean Absolute Deviation 42
Standard Deviation 51
Coefficient of Variation 0.2
Relative Standard Deviation 20%
Interquartile Range (IQR) 86
Mean 248
Median 257
Mode 205
Source: Calculated from data in Table 1
Next week I shall wrap up this discussion of the first performance indicator by considering certain facets of the production data and introduce comparisons between annual sugar production targets as stated in the Annual National Budgets and actual output for the corresponding year.