This week’s column concludes consideration of the sugar industry’s land productivity measure; that is tonnes cane (TC) per hectare (HA) of harvested land. I shall first report the available information for this variable by estate. This is intended to complement the data provided last week, as well as offer  further information on the performance of the overall industry (that is the estates and private independent cane farmers combined and as separate groups).
Table 1 reveals these estates’ data for the latest available year 2012 (these data are unaudited); the latest GuySuCo estimate for 2013; and, GuySuCo’s Strategic Plan forecast for 2017.
Table 1 Cane Yields by Estate (TC/HA)
Estate 2012(1) 2013(2) 2017(3)
Skeldon 54.14 51.37 67.56
Albion 56.06 59.59 73.13
Rose Hall 56.93 48.60 72.99
Blairmont 66.61 56.30 75.67
Enmore 53.72 49.54 72.68
Wales 53.28 54.18 69.71
Uitvlugt 45.67 39.46 68.47
Notes: 1 = unaudited 2) = latest estimate 3 = Strategic Plan forecast
Source: GuySuCo 2013
Summarily, the observations of note are: 1) The four Berbice estates as a group performed significantly better than the Demerara estates in 2012; the worst performing estate in that year was Uitvlugt (with a yield of 45.67 tonnes per hectare) and the best performing estate was Blairmont (66.61 tonnes) 2). In 2013, Uitvlugt’s cane yield was estimated to be as low as 39.46 tonnes per hectare. Significantly, Blairmont lost its premier status when its yield fell from 66.61 tonnes in 2012 to 56.30 tonnes in 2013. That premier position was held by Albion in 2013 with a yield of 59.59 tonnes of cane per hectare.
3) The cane yields forecast for 2017 reveal substantial improvements for all the estates, although these yields do not approach those that were obtained as far back as 1960 (94 tonnes per hectare). 4) In 2017, the lowest forecasted yield per hectare for any estate is Skeldon (67.56 tonnes) but this forecast is well above that previously obtained by any estate in 2012 and 2013! 5) The regional trend is maintained in that the Berbice estates as a group are expected to outperform those in Demerara. 6) Skeldon’s poor performance in its cane yield should be especially noted as this estate has been projected to become the lynchpin of the industry’s modernization.
Factory productivity
As a rule, sugar analysts define the best measure of factory performance and efficiency as the recovery ratio or number of tonnes cane (TC) a sugar factory utilizes in order to produce one tonne of sugar (TS). I turn next to consider this performance measure.
First, I begin by reporting on the average (mean) number of tonnes cane (TC) required to produce a tonne of sugar (TS) during the 1990s and 2000s, that is TC/TS. These data are shown in Table 1:
Table 1 GuySuCo: Tonnes cane per tonne sugar (TC/TS)
Period Mean TC/TS
1990s 12.52
2000s 11.47
Source: GuySuCo Reports (various)
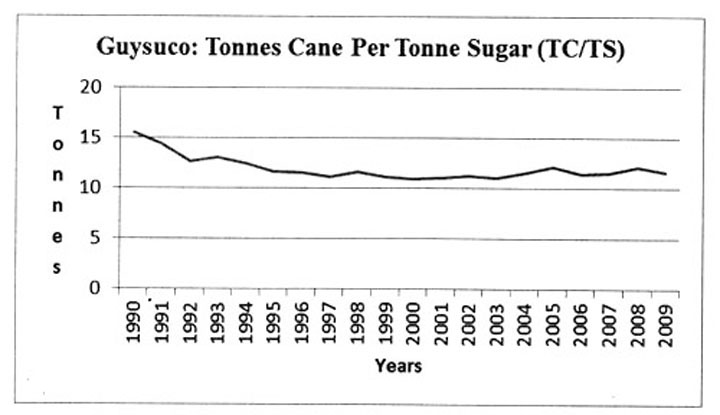
The detailed data used to calculate the results shown in Table 1 indicate substantially less annual variation in this variable than there was for cane yield (TC/HA). As can be immediately gleaned from the table, there was a slight improvement in the recovery ratio, since the tonnes of cane required to produce one tonne of sugar fell from 12.52 in the 1990s to 11.47 tonnes in the 2000s. The mean average deviation for the 1990s annual data was only 1.11 and this fell to 0.35 during the 2000s. The range in the 1990s data was from a low of 11.10 tonnes in 1999 to a high of 15.54 tonnes in 1990. The range for the 2000s was from 10.88 tonnes in 2000 to 12.20 tonnes in 2005. These variations are more clearly observed in the graph below.
The current situation in Guyana as regards the overall factory recovery ratio and GuySuCo’s forecast for 2017 is indicated in Table 2. Generally there has been improvement, as less cane is needed to recover each tonne of sugar over the years 2012, 2013 and 2017 respectively. The overall number of tonnes forecast to be required in 2017 is 10.98. Although improved, this performance would be still worse than the overall recovery rate, which obtained as far back as 1960.
Table 2 Current & Forecasted Factory Performance (All Estates) – TC/TS
Item 2012(1) 2013(2) 2017(3)
All Estates 12.43 12.35 10.98
1 = unaudited; 2 =latest estimate; 3 = Strategic Plan forecast
Source GuySuCo, 2013
Private cane
Readers would know that the existing arrangement in the industry is one where private independent cane farmers cultivate their cane and send it to be processed at the factory of the estate to which they are attached. I do not have at this point in time up-to-date direct information provided by GuySuCo on the factory recovery ratio for farmers’ cane as a separate category. I have, however, estimated the ratios for 2012, 2013 and 2017 from the data, which I obtained on farmers sugar and cane output. These are shown in Table 3:
Table 3 Factory Recovery Ratio – Farmers Cane (TC/TS)
Item 2012(1) 2013(2) 2017(3)
Farmers Cane 14.2 13.0 11.9
Notes 1 = unaudited; 2 = latest estimate; 3 = Strategic Plan Forecast
Source = Estimated from GuySuCo, 2013
While as a rule the factory recovery ratio for farmers’ cane is slightly worse than that for the estates’ cane, there is projected improvement. In 2017, the ratio is projected at 11.9, down from 14.2 in 2012.
In conclusion, it should be noted that the disastrous factory outcome at Skeldon has had a huge negative impact on GuySuCo’s overall factory recovery ratio, considered as a performance measure for the industry.