Challenges
My last column noted that poverty measures based on income/consumption surveys, like the previously considered World Bank 1992, UNDP1999, and the HIES 2006 surveys have been seriously challenged by several analysts. The challenges have been in regard to their suitability for the task and the comprehensiveness of their coverage. The challenges have come from several angles two of which are of immediate relevance to the present discussion (readers who would wish to pursue this topic further should consult Section v3 of the Conclusion in the UNDP’s Guyana Survey of Living Conditions (GSLC), 1999, which I authored).
First, there is the concern over whether reliance should be put on consumption or income indicators of individual and household welfare. These differ in survey results, as we shall observe for some of those presented below. As a rule, however, consumption is preferred to income as a measure of well-being in Guyana for at least three reasons. One is the prevalence of a large phantom, underground or parallel economy whose income reporting is notoriously poor. Another is that respondents to survey questions are very reluctant to disclose their income truthfully, if at all. Further, it has been observed that over longer periods of time consumption has been observed to be much more stable and less volatile than income. This therefore makes it a better long-term indicator of welfare in Guyana.
Second, there is the concern that surveys like those cited above invariably present opportunities for analysts to estimate whether the basic needs of the surveyed population are met or remain unmet; in other words to determine the extent to which the surveyed population are deprived of their basic goods and services. Given this feature, it has been suggested that all such types of surveys should provide for a basic needs assessment as a complementary indicator. Of note in Guyana a lot of the basic services are publicly funded/provided or assisted. The crucial consideration therefore is agreement on what should comprise the population’s basic needs.
Basic needs
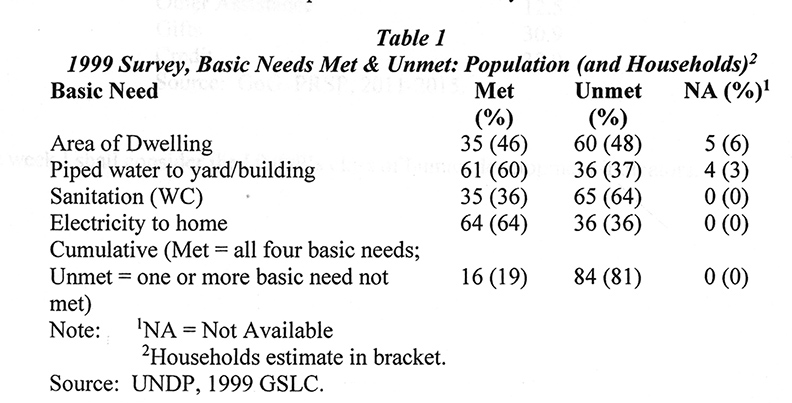
In the 1999 GSLC, four basic needs were identified, as shown in Table 1. These were 1) household living space availability per person; 2) household access to piped water; 3) household sanitation; and 4) household access to electricity. In Table 1 the bracketed percentages represent household data and the unbracketed items represent the individual population. The largest unmet need in the survey is living space and sanitation, 60 and 65 per cent respectively. Readers should note carefully the variation in individual and household response. Cumulatively it was found that one or more basic needs was unmet for 84 per cent of the surveyed population!
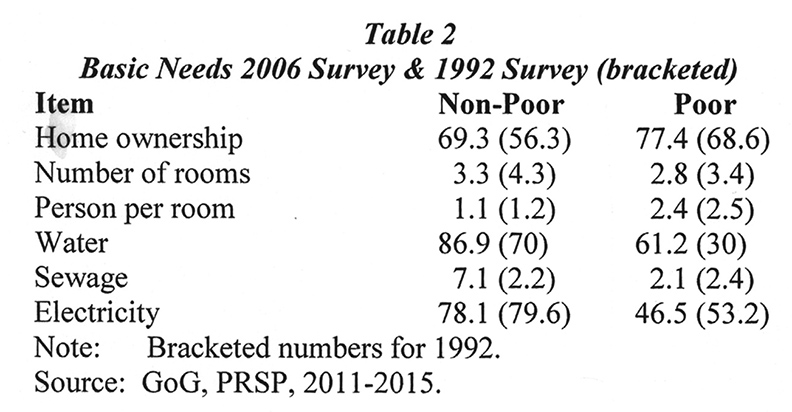
For the 2006 HIES survey six basic needs were identified. These were 1) home ownership; 2) the number of rooms in the dwelling; 3) the number of persons per room; 4) water access; 5) sewerage access; and 6) electricity in the home. These basic needs are compared with similar ones used in the 1992 World Bank survey and reveal significant improvement over the intervening years, particularly in the areas of home ownership and access to water. The most disappointing basic need outcome is for electricity, which has remained virtually unchanged over the long interval 1992 to 2006.
This discussion of basic needs and deprivation leads directly to the need for a review of the United Nations Development Programme (UNDP) class of human development indicators. These indicators will be considered next week for two good reasons, namely 1) these measures are rooted in deprivations and unmet basic needs among the population, and 2) the existence of time series for these data going back more than a quarter of a century in the case of Guyana.
Coping mechanisms
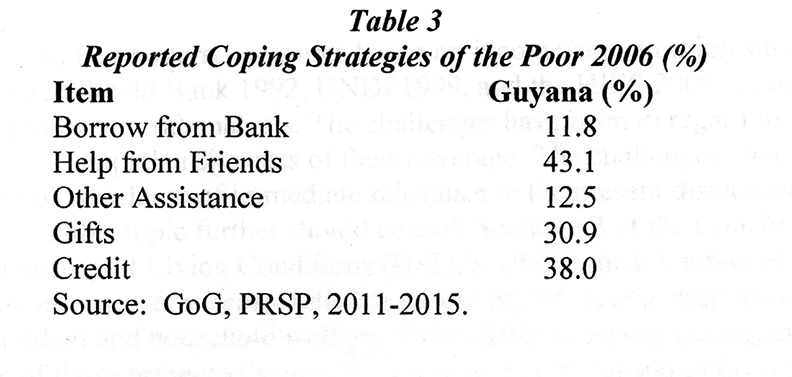
The 2006 HIES survey also sought to find out how respondents coped with the pressures of living below the poverty line. The tale revealed would be readily recognized by most Guyanese; the largest category of coping responses was help from friends. Next in line was credit from places of purchase (shops, markets and other such vendors). This was followed by gifts. Compared to these, borrowing from banks played a small role. These data are shown in Table 3.
Next week I shall consider the UNDP’s class of human development indicators.