Introduction
Following last week’s description of the World Economic Forum’s (WEF), annual Global Competitiveness Index (GCI), today’s column focuses on Guyana’s results. Guyana is one of only three Caricom countries reported on by the WEF. Today’s column is also the last in the series dealing with appropriate measures of Guyana’s economic size, progress, and national/individual well-being/welfare.
The position I have advocated is that, for the foreseeable future, the GDP will remain the premier measure of economic performance. Two alternatives though, have emerged as complementary/supplementary; these are the Human Development Index (HDI) and the GCI. I have already addressed Guyana’s HDI performance, and will not repeat it here.
Theoretical controversy
 Last week I briefly alluded to the theoretical controversies over the notion of national competitiveness, in an economic sense. Some analysts argue that globally, firms compete. Thus when GuySuCo sells sugar overseas, it is competing with other sugar producers. Similarly, industries and/or economic sectors compete globally. Thus when our rum producers, as a group, export their different brands, the rum industry or sector is competing globally with other alcoholic exporters (for example, whisky exporters). Similarly, when our interior-located mines and forests export their products, they are competing globally with other exporting regions. It is only through these means (firm, industry, sector or region) that nations actually compete economically.
In this sense therefore, national economic competitiveness is a misnomer. Indeed these analysts go further and claim that, what is termed national competitiveness, represents national productivity. And, productivity is but one element, albeit a major one, in determining economic competitiveness.
Source material
As noted, two primary sources provide information for computing the GCI. First, data supplied by international, regional and national bodies. Such sources provide data on GDP and its components, population, health, education, employment, prices and so on. Second, information obtained through its Executive Opinion Surveys (EOS), administered in partnerships with country institutes (about 14000 respondents). Its Guyana Partner Institute is the Institute of Development Studies (IDS) at UG. In the interest of full disclosure I was the last Director of that institution.
Annually, the total number of countries surveyed is reported. The main limitation on country coverage is data availability because an EOS has to be successfully concluded. These EOSs assess the voice of the business community, in 15 dimensions.
Guyana results
Table I presents information on Guyana’s GCI performance for the past five years (2011-12 to 2015-16). The number of countries covered varies, and over the past five years, this varied from 140 to 148. The score for a country’s computed performance is given on a scale of 1-7, where 7 represents the best possible outcome and one, the worst possible. Based on each country’s score, its ranking out of the total number of countries covered in each year’s GCI, is given.
The detailed 2015-16 results show 1) the number of countries covered is 140; 2) Guyana’s rank is low, 121st out of 140 countries; 3) its score, at 3.6, is the
same as for 2014-2015, which is less than for the three preceding years (2011-2012 to 2013-2014). Generally, one might say Guyana’s performance has deteriorated recently.
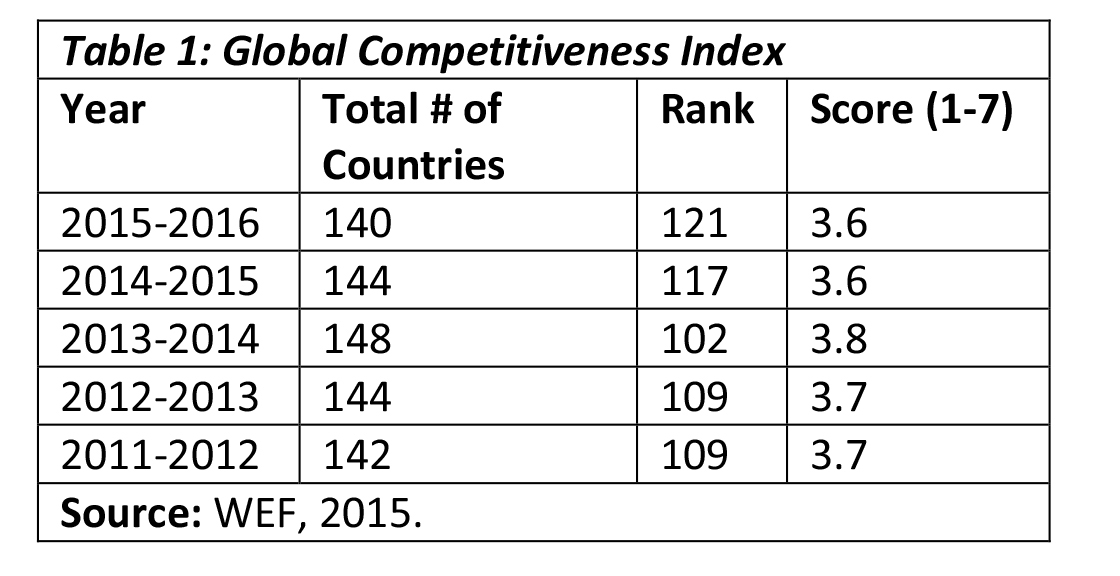
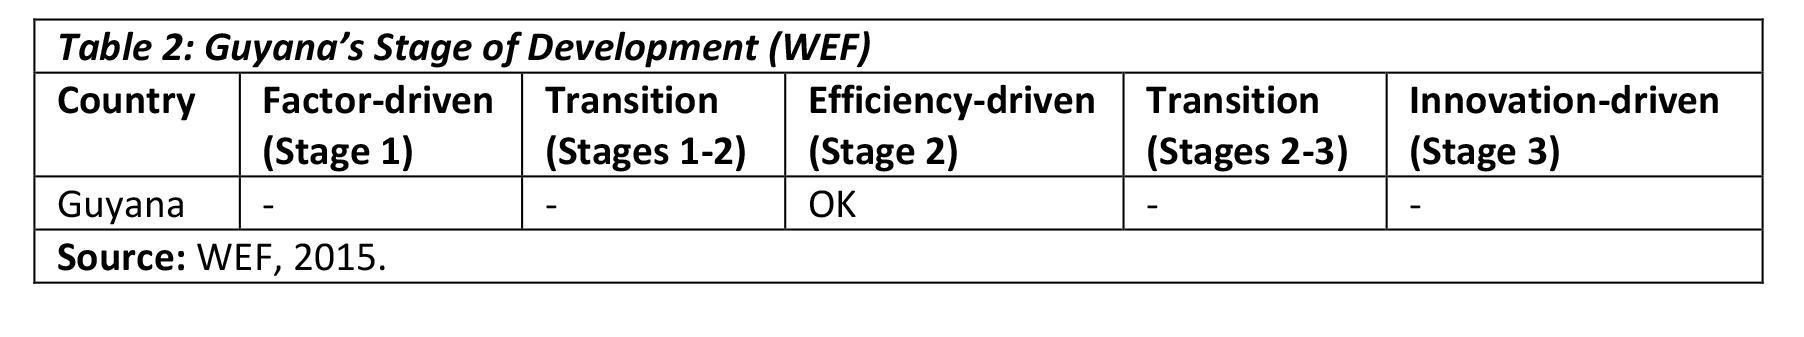
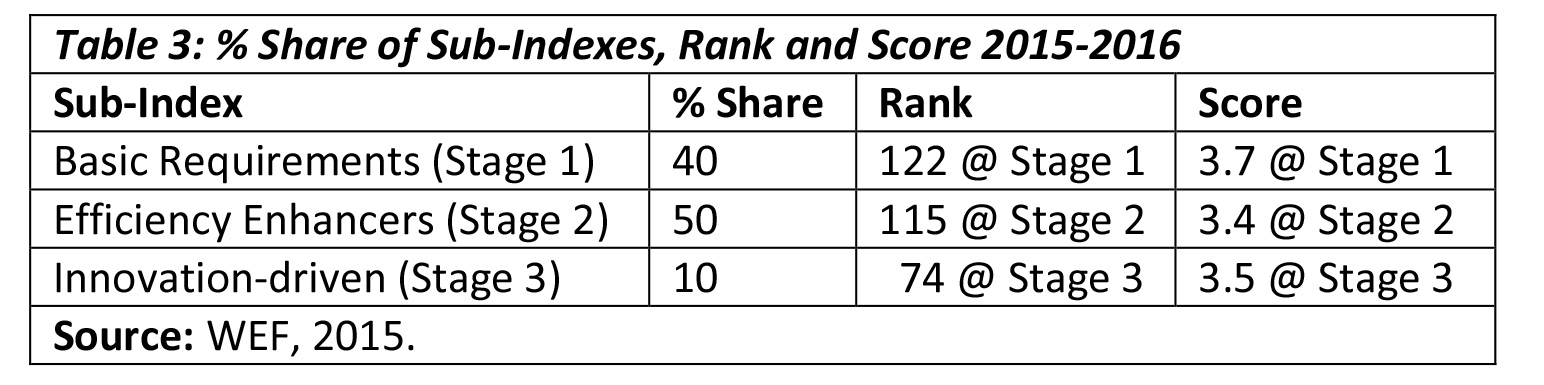
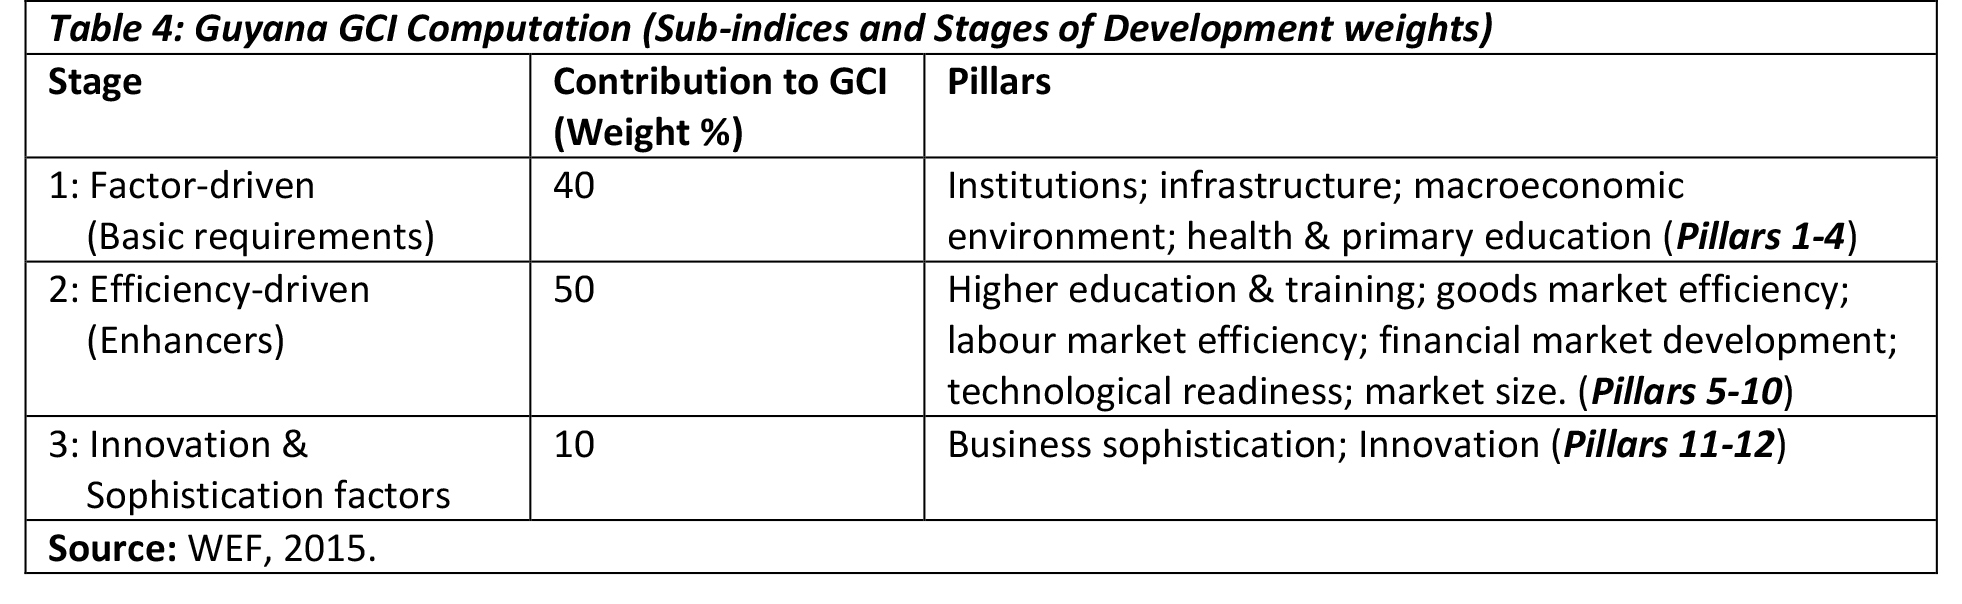
Table 2 reveals the WEF categorizes Guyana’s economy at Stage 2 (efficiency-driven). Table 3 shows the weights attached to the 12 pillars on which the Guyana Index is constructed. Further, Guyana’s performance weights for each stage of development, and its rank by that stage is also shown. This is more clearly revealed in Table 4, where the stages of development, weights, and pillars are highlighted.
Corrupt practices and competitiveness
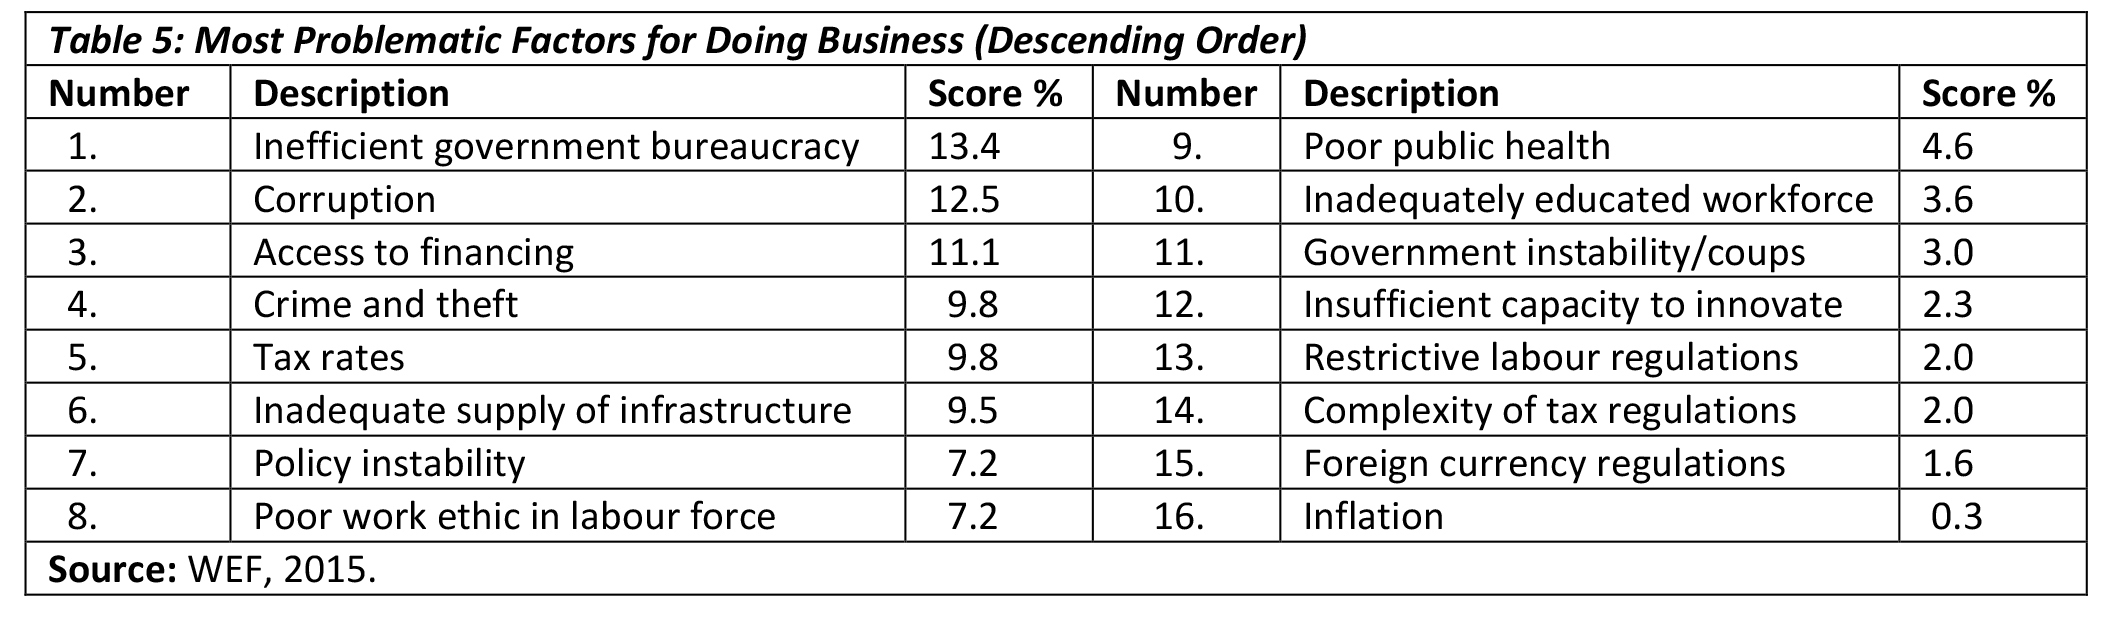
Finally, Table 5 identifies the ten most problematic factors for doing business in Guyana. The percentage response for each factor is shown. Of special note, corrupt practices, defined as corruption, crime and theft account for over one-fifth (22.3 per cent) of responses. Responses reflecting inefficiencies in macroeconomic management (taxes, bureaucracy, factor productivity, finance, training, etc) are expected to dominate, which they do. However, such a large share of responses falling under the rubric of corrupt practices is an important marker on where Guyana stands.