Trend in money supply
As Guyana celebrates its Golden Jubilee, it is perhaps good to talk about something that is on their minds. No doubt lots of money will be spent during this period of festivity. It is perhaps a good time to take a look at how the money supply behaves. This article is interested therefore in the trend in the money supply over the last 10 years.
Three levels
 The money supply of a country consists of the stock of currency and other short-term or liquid assets in the financial system. The money supply always starts from a monetary base and then increases as other forms of money enter the picture. It is no exception in the case of Guyana. A perusal of the Annual Report of the Bank of Guyana reveals that the money in Guyana consists of three levels. The first or base level is known as reserve money. It is often depicted with the symbol M0. The second level is described as M1 and the next level is referred to as M2. The three levels reveal an important thing about the Guyana economy and that is a limited range of items is considered money.
Base money
Like in other countries, base money or reserve money in Guyana consists of the currency in circulation and the money that commercial banks hold as deposits in the central banking system, the Bank of Guyana in the case of this country. The level of deposits that commercial banks have in the BOG results largely from what is known as the reserve requirement. The BOG decides on the level of the reserve requirement (usually a percentage of deposits) and the financial institutions have to abide by it. In Guyana’s case, the reserve requirement is 12 per cent. This means that all financial institutions have to hold at least 10 per cent of their deposits in an account at the BOG, even though they can keep some amount of it in their vaults at their own banks.
The significance of the reserve requirement is that it determines the excess liquidity to which banks have access to make loans. The reserve money is used to help banks to satisfy payment transactions in which cheques are used. Once it is properly estimated, reserve money will not change significantly, unless there is substantial growth in deposits to commercial banks or movement in foreign assets.
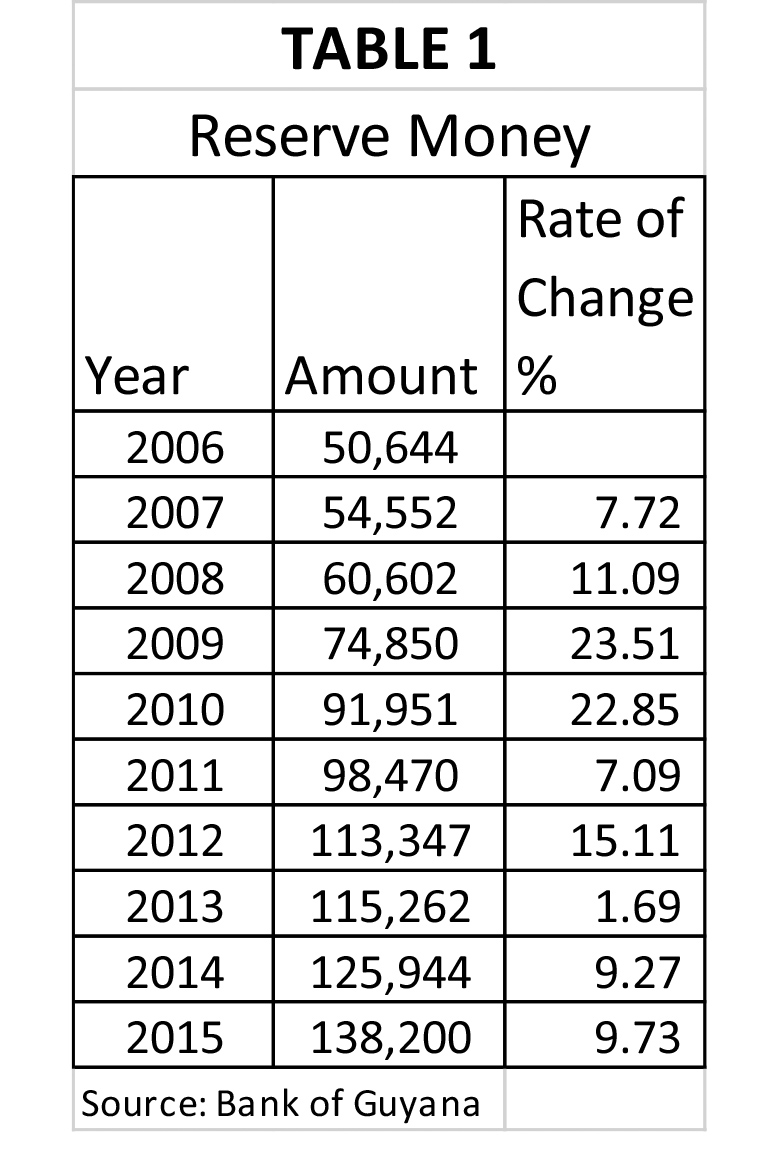
Table 1 above shows that significant change in the reserve money occurred in 2009, 2010 and 2012. The largest change was in 2009 when the net foreign assets of the BOG doubled in size. This was a period when gold prices were on the rise. It was also the year in which Guyana passed new anti-money laundering legislation. The next year saw the growth in the reserve money continue with the growth being almost as high as the previous year. Again, the explanation for the sizable growth was given as a substantial growth in the net foreign assets of the BOG. The increase in foreign assets stemmed from increases in the market securities which the BOG held.
Slower growth
The slower growth in reserve money in 2011 stemmed from the slower growth in net foreign assets. The situation in 2013 slowed considerably more than in previous years to one per cent and again net foreign assets did not perform as well as before. The growth in reserve money remained relatively slow, below 10 per cent, as a consequence of slower growth in net foreign assets. In response, the BOG reduced its exposure to market securities and started substituting gold for some market securities.
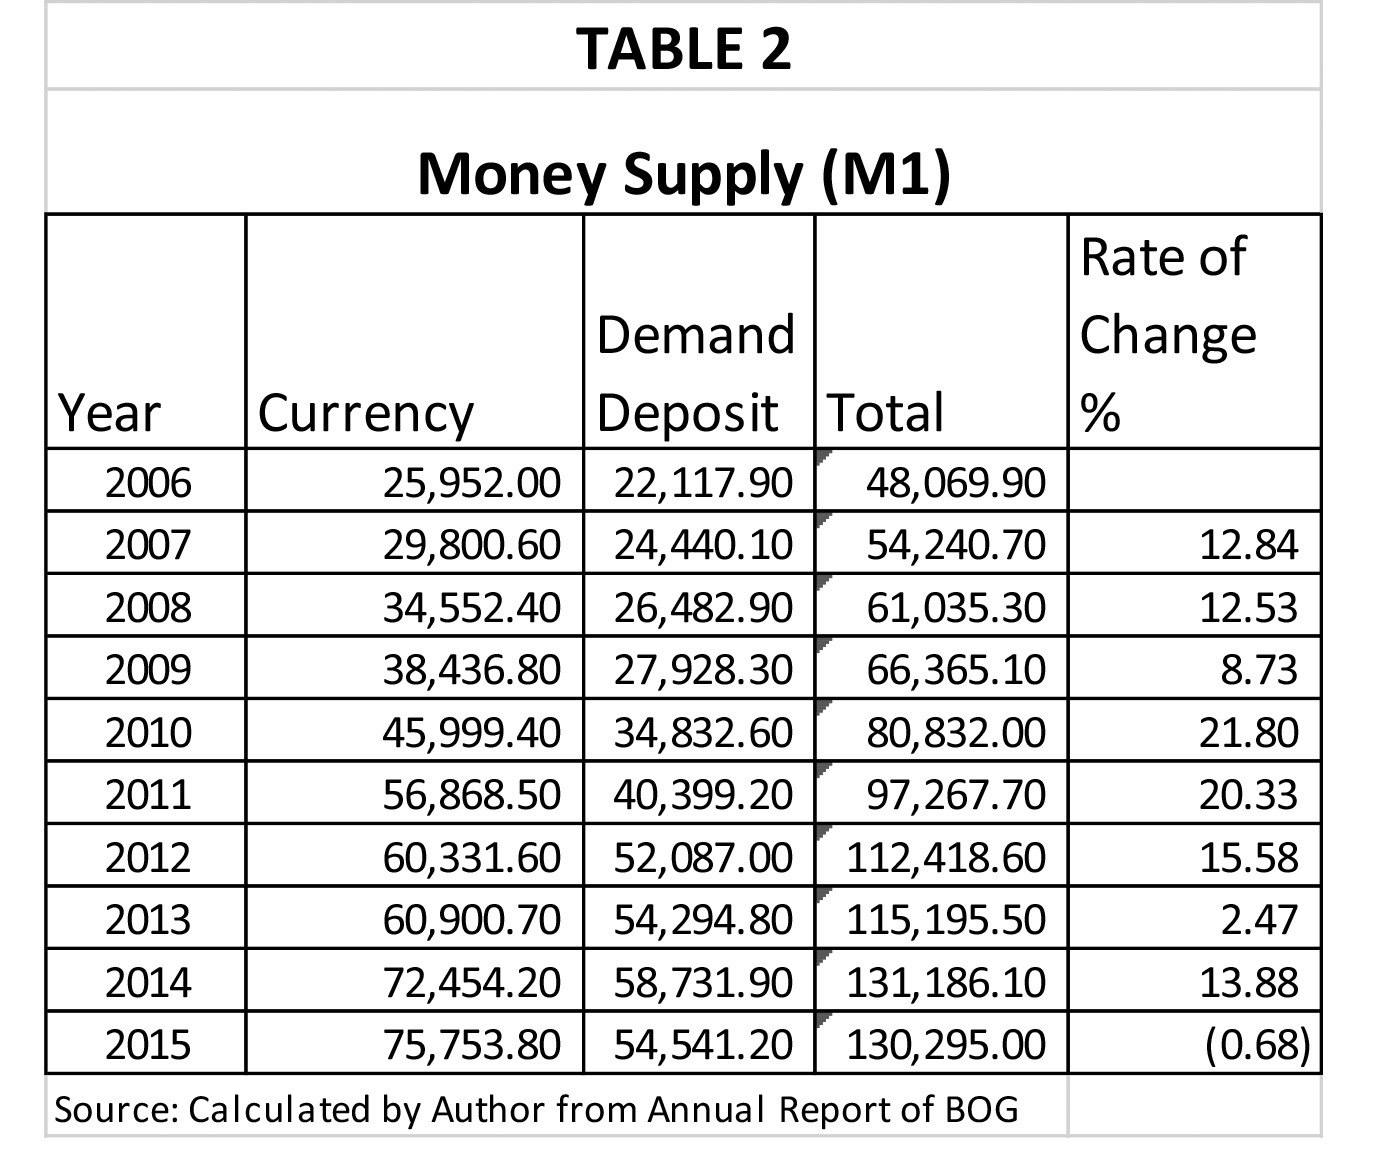
While M0 facilitates payment settlements between banks, M1 facilitates transactions by the public. This level of the money supply consists of money in circulation and demand deposits (chequing accounts) held at commercial banks by natural and artificial persons as shown in Table 2 above. It should be noted that annual reports of the BOG indicate that cashiers’ cheques and Banker’s Acceptances form part of the demand deposit figure used in calculating M1. Again, one sees that the money supply, in this case, narrow money, presents an interesting picture of how the money behaved over the 10-year period of 2006 to 2015.
Table 2 reveals that narrow money showed robust growth of 22 and 20 percent in 2010 and 2011. The bulk of the money was in cash, even though there were substantial amounts in demand deposit accounts. The M1 money supply reflects some level of economic activity in the economy and the decline by 0.68 percent in 2015 is indicative of the slowdown in the economy. People were not spending as much money as before.
Greater focus
The greater focus of the monetary authorities is on the next level of the money supply, M2. This level consists of the currency in circulation, the demand deposits and the time and savings deposits. It would appear that a substantial amount of the money in savings and time deposits impact the level of spending activity in the economy. Table 3 below shows the composition and trend of the M2 or broad money as it is described.
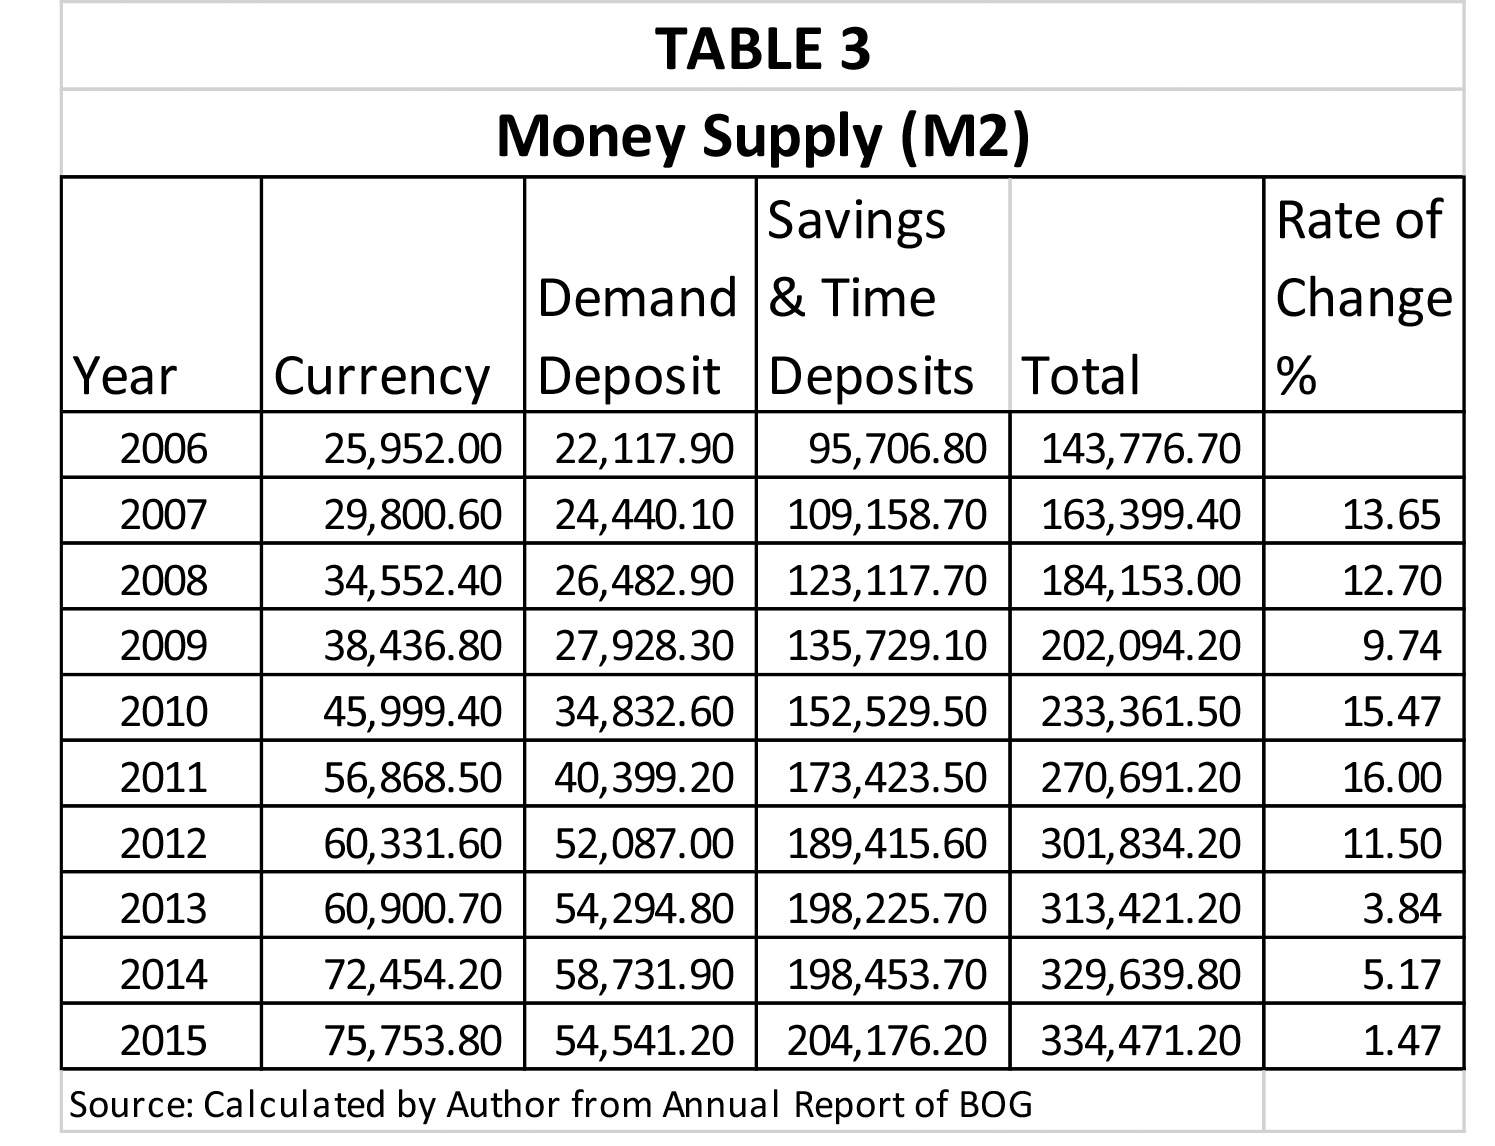
From Table 3, one can see that the largest component of the money supply is the money that households and businesses have in savings accounts. The savings account is responsible for close to two-thirds of the money in the economy. For all practical
purposes, it could be said that Guyanese keep their money within hand reach. The behaviour of this monetary aggregate serves as a signal to the monetary authorities to keep an eye on or even alter interest rates. It also serves as a signal for them to maintain a watchful eye on changes in the price level.
Trend
The trend in the rate of change reveals that the Guyana economy started slowing down significantly from as early as 2012 when the money supply began to increase at a decreasing rate. Clearly, deposits were not making it into the banking system as they did in periods prior to 2012. One must wonder about the cause of the slowdown in the money supply.
Happy 50th Independence Anniversary to all Guyanese.