On-going series
The recent media release by ExxonMobil to the effect that the findings of its second offshore well (Liza 2) appear to confirm the substantial size of Guyana’s potential oil and gas reserve, presents me with a welcome opportunity to remind readers that my recent columns on Guyana’s extractive forest sub-sector are directly linked to an ongoing series dedicated to evaluate Guyana’s future  as an intensive natural resources extraction-dependent economy, in the coming time of large-scale oil and gas production and export. My argument is: this circumstance offers the profoundest opportunity for Guyana’s structural transformation, since its Independence, half-a-century ago.
Readers would recall this series has already considered gold and bauxite as strategic mineral sub-sectors, and is presently pursuing a discussion of forestry, which is easily the most strategic non-mineral extractive sector.
Weak returns
Readers would recall also, last week’s column sought to establish how, despite the humongous presence of the forests (and relatedly the hinterland communities) in Guyanese society, their net return, in terms of value added to the economy, has been woefully weak, highly erratic, and on average declining over recent decades.
Thus, as shown earlier, while on average over the past decade the percentage contributions of the extractive forest sector to GDP have been 3.1 per cent and 3.7 per cent respectively, in real and nominal values; two decades ago (1995-1996), the extractive forest sub-sector’s contribution to GDP averaged about 4.7 per cent at constant prices. Unmistakably, the sub-sector’s contribution to real economic growth has declined substantially since then. By itself, this is a distressing outcome; however, because Guyana enjoys a highly acclaimed standing in the world of forests, this has been sorely disappointing.
Controversy
There is a potentially raging controversy lurking in this outcome, which I plan to address more fully in next week’s column. As we saw, the indications are that Guyana has had one of the world’s lowest rates of deforestation. And most analysts seem to attribute this result mainly, if not entirely, to the deeply-rooted environmentally sustainable cultures of Guyana’s indigenous forest-dependent population. The question, which needs to be asked is whether such conclusions are warranted, or if perhaps other equally persuasive factors account for this outcome.
Operations structure
Before considering these grave topics, I must first portray the main operational features of the sub-sector from a regulatory standpoint. The Guyana Forestry Commission (GFC) periodically publishes productive allocations of state forest lands. These comprise four main categories, namely 1) State Forest Permissions (SFPs) which are granted for two years for an area of no more than 8,047 hectares; 2) Wood Cutting Leases (WCLs), which are granted for a period of up to ten years, for an area between 8,047 and 24,000 hectares; 3) Timber Sales Agreements (TSAs): these are granted for an area in excess of 24,000 hectares and for a period of up to 30 years. All the above are renewable, subject to compliance with the terms of their respective agreements. 4) State Exploratory Permits, which are granted for three years. And, as the description implies, these are precursors to TSAs and WCLs.
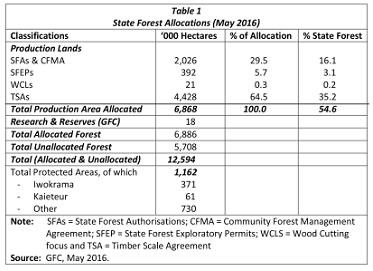
Table 1 below shows the latest forestry land allocation as reported by the GFC (May 2016).
The information provided in Table 1 captures important features in the administration of operations in the state forest estate. First, the area allocated by the state for production purposes is of the order of 6.9 million hectares. Second, this total represents about 55 per cent of the state forest estate. Third, the unallocated area is about 5.7 million hectares, giving a combined total (allocated and unallocated) of approximately 12.6 million hectares. Fourth, the ranking of the shares of allocations by purpose shows that Timber Sales Agreements (TSAs) accounted for just under two-thirds of the total; State Forest Authorizations and Community Forest Management Agreement about thirty per cent; and State Forest Explorating Permits (SFEPs) just under six per cent. Wood Cutting Leases (WCLs) were minimal (less than one per cent).
The Protected Areas totaled 1.2 million hectares, including the well-known Iwokrama Reserve (391 thousand), Kaieteur National Park (61 thousand) and the ‘Other’ category totalling 730 thousand hectares. The ‘Other’ category includes Shell Beach and the Kanuku Mountains.
Forest licences
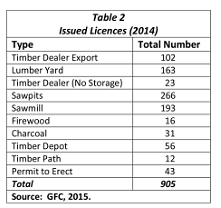
In addition to the land allocation breakdown presented in Table 1, the GFC grants licences (valid for one calendar year) to various operations in the forest products sectors. These have to be renewed annually. Their number varies from 266 (sawpits) to less than one-tenth of that (timber dealers, no storage), firewood, and timber path operations). The total number of such licences granted in 2014 was 905 with their distributed location in Demerara, Essequibo and Berbice, in that order of ranking. The total represented an increase of more than one hundred licences over the previous year. These details are shown in Table 2.
Next week I shall continue this line of analysis.