Conclusion
Not easy
 Last week we identified the money supply, the credit provided by the private sector lending institutions and the interest rates associated with both savings and loans. These are monetary variables that help one to obtain a sense of the behaviour of the economy and the key participants thereof. Discussing these issues is not an easy task, especially as one attempts to simplify them and avoid the theoretical arguments behind the use and value of these -variables. Yet, there is value in using the reasoning behind the theories to gain insights into the Guyana economy. In last week’s contribution it was also observed that the money supply was made up of the liquid assets that people and businesses use to make payments and to engage in short-term investments.
Government
Government also spends money and makes investments. Normally, the government takes money out of the system through the taxes that are paid to it. It then returns most of that money by spending it through the budget process. The procurement activity of the government is an important part of its spending process. Through procurement activities and other investments, government is able to put money back into the economy. Government also adds money through borrowing or receiving aid funds from foreign governments and international financial institutions and spending it in the economy. However, the official GDP data indicates that the largest spenders are the households and businesses.
The three variables that are being examined are of greater concern to household and business spending. In other words, they are linked to investment and consumption spending, economic activities that matter to the condition of the economy. Going back to the money supply, a review of Table 1 that was published last week reveals several things. The data in the table showed the actual values of the money supply each month from May 2015 to May 2016. In looking at the data, one is able to see that from June 2015 to September 2015, the money supply declined. When the moving average is used, one observes that the decline was concentrated in the period July to September 2015.
Decline
This decline should not come as a surprise since the period in question was immediately after the general elections. There was no budget in place and public spending was restricted by law. The government could not spend more than one-twelfth of what it had spent the previous year until a budget and an Appropriations Bill were passed. The reasons for the absence of a budget until later in the year stemmed from one principal political cause. The previous government was fearful of a no confidence vote against it and refused to reconvene Parliament to pursue the adoption of a budget. Consequently, the preparation of the budget had to await the outcome of the elections that had been called. Since the elections led to the formation of a new government, which then spent time preparing the budget for presentation in August, and approval in September.
Uptick
Once that happened there was an uptick in the money supply for the last quarter of 2015. The growth was not very strong and was barely perceptible at a 0.5 per cent increase. For the entire 12-month period, the growth was even slower at 0.2 per cent. This contrasts with earlier periods in which the money supply grew by an annual average of 11.5 per cent. The very small rate of growth that is observed in the money supply today indicates that it might only be the spending of the government that is significant and enabling the economy to move forward, albeit slowly.
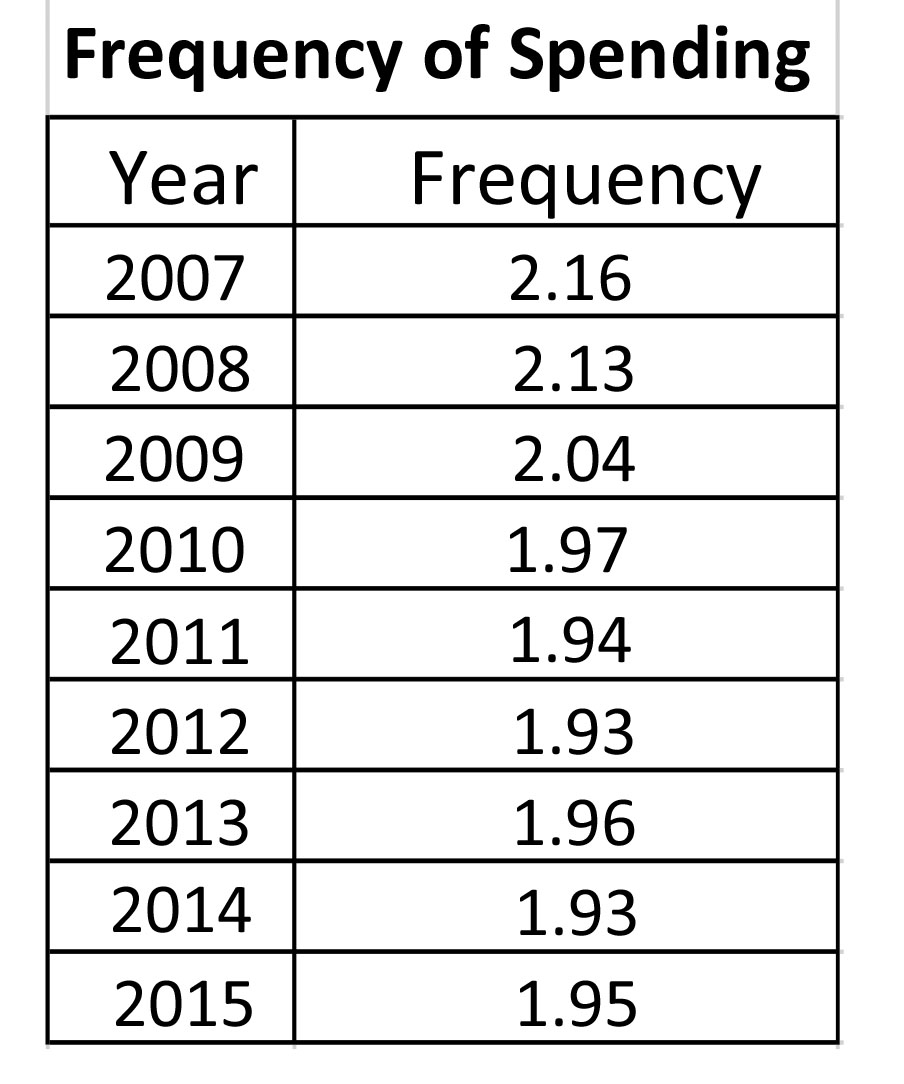
Connected to the behaviour of the money supply is the speed with which money turns over in the economy. This rate of change refers to the amount of times each dollar was used in the economy.
The table above shows that since 2007, the frequency with which each dollar was turning over in the economy was declining. Money was turning over, but at a much slower pace than one might want to admit. This observation makes for interesting research for, despite the growth that took place in the economy from 2007 to 2013, money was changing hands fewer times in the official economy than people were given to believe. Even in current times, there is the claim that the economy is not growing because of the absence of government policy. The data depicted in graphical form below indicate that other factors are interfering with the progress of the economy.
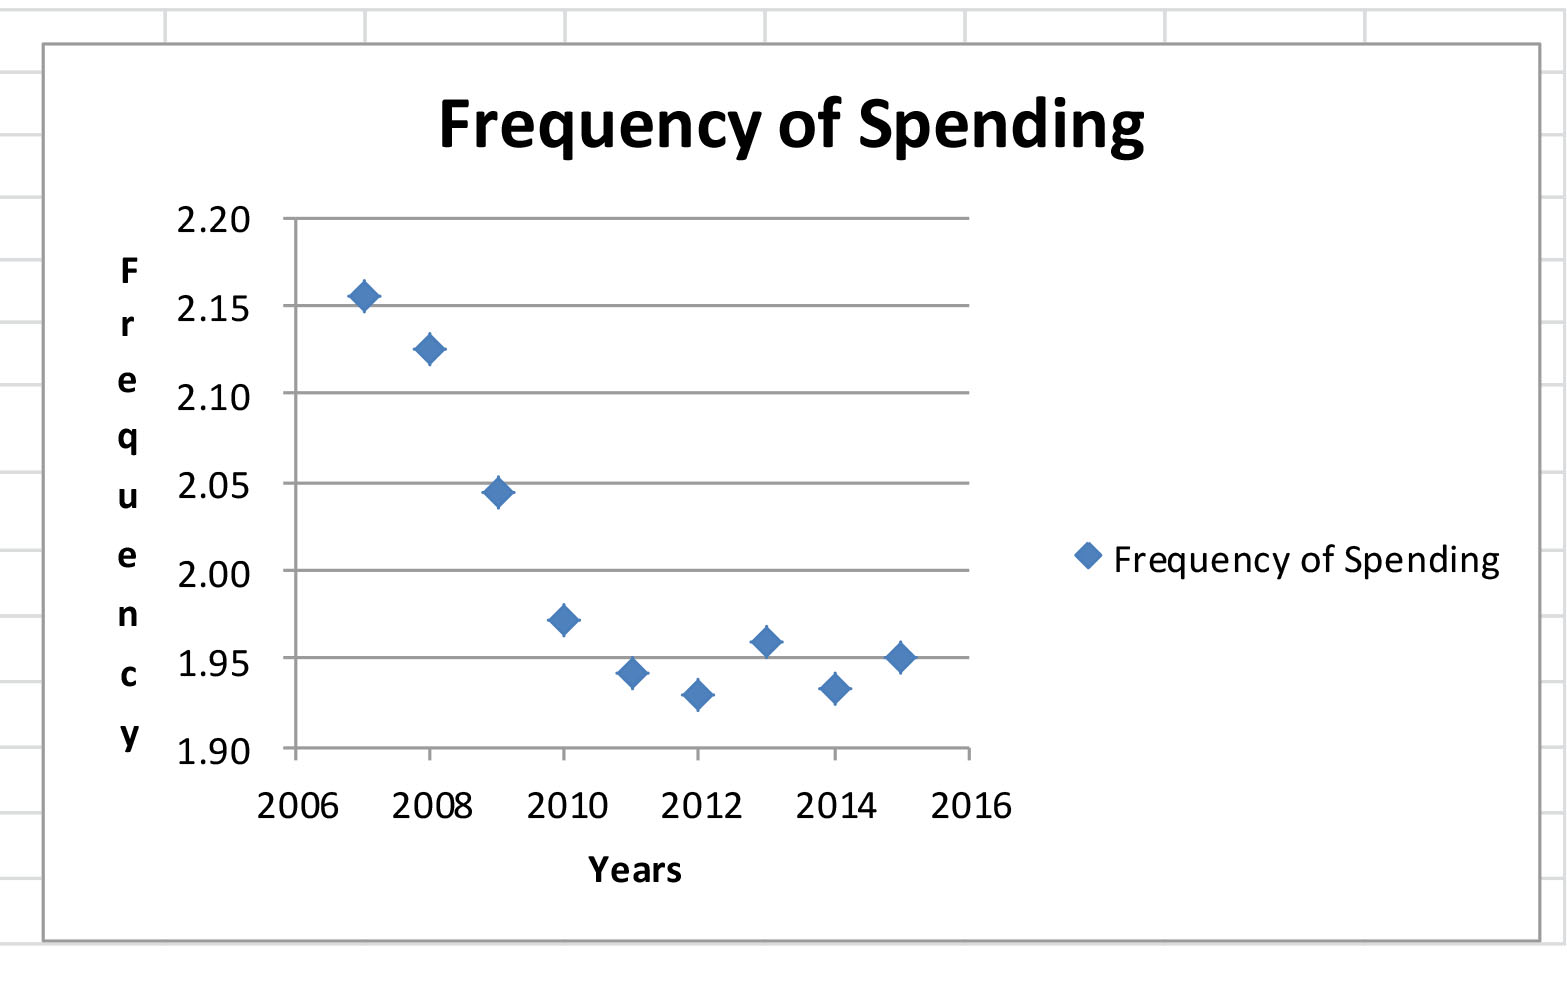
The figure shows a downward trend in the income velocity of money. The two years of growth in the velocity of circulation, 2013 and 2015, are exceptions to a trend that deserves further inquiry.
Credit
At the same time, credit to the private sector increased five per cent from May 2015 to May 2016. However, from October 2015 to May 2016, credit grew by two per cent. The growth in credit is evidence that the private sector is participating in the economy but might still be cautious. The banking system might be responding to this conservative attitude of the private sector by reducing interest rates as a means of stimulating borrowing. Since November 2015, interest rates have declined progressively when one uses the 3-month moving average to assess performance of that variable.
Optimism
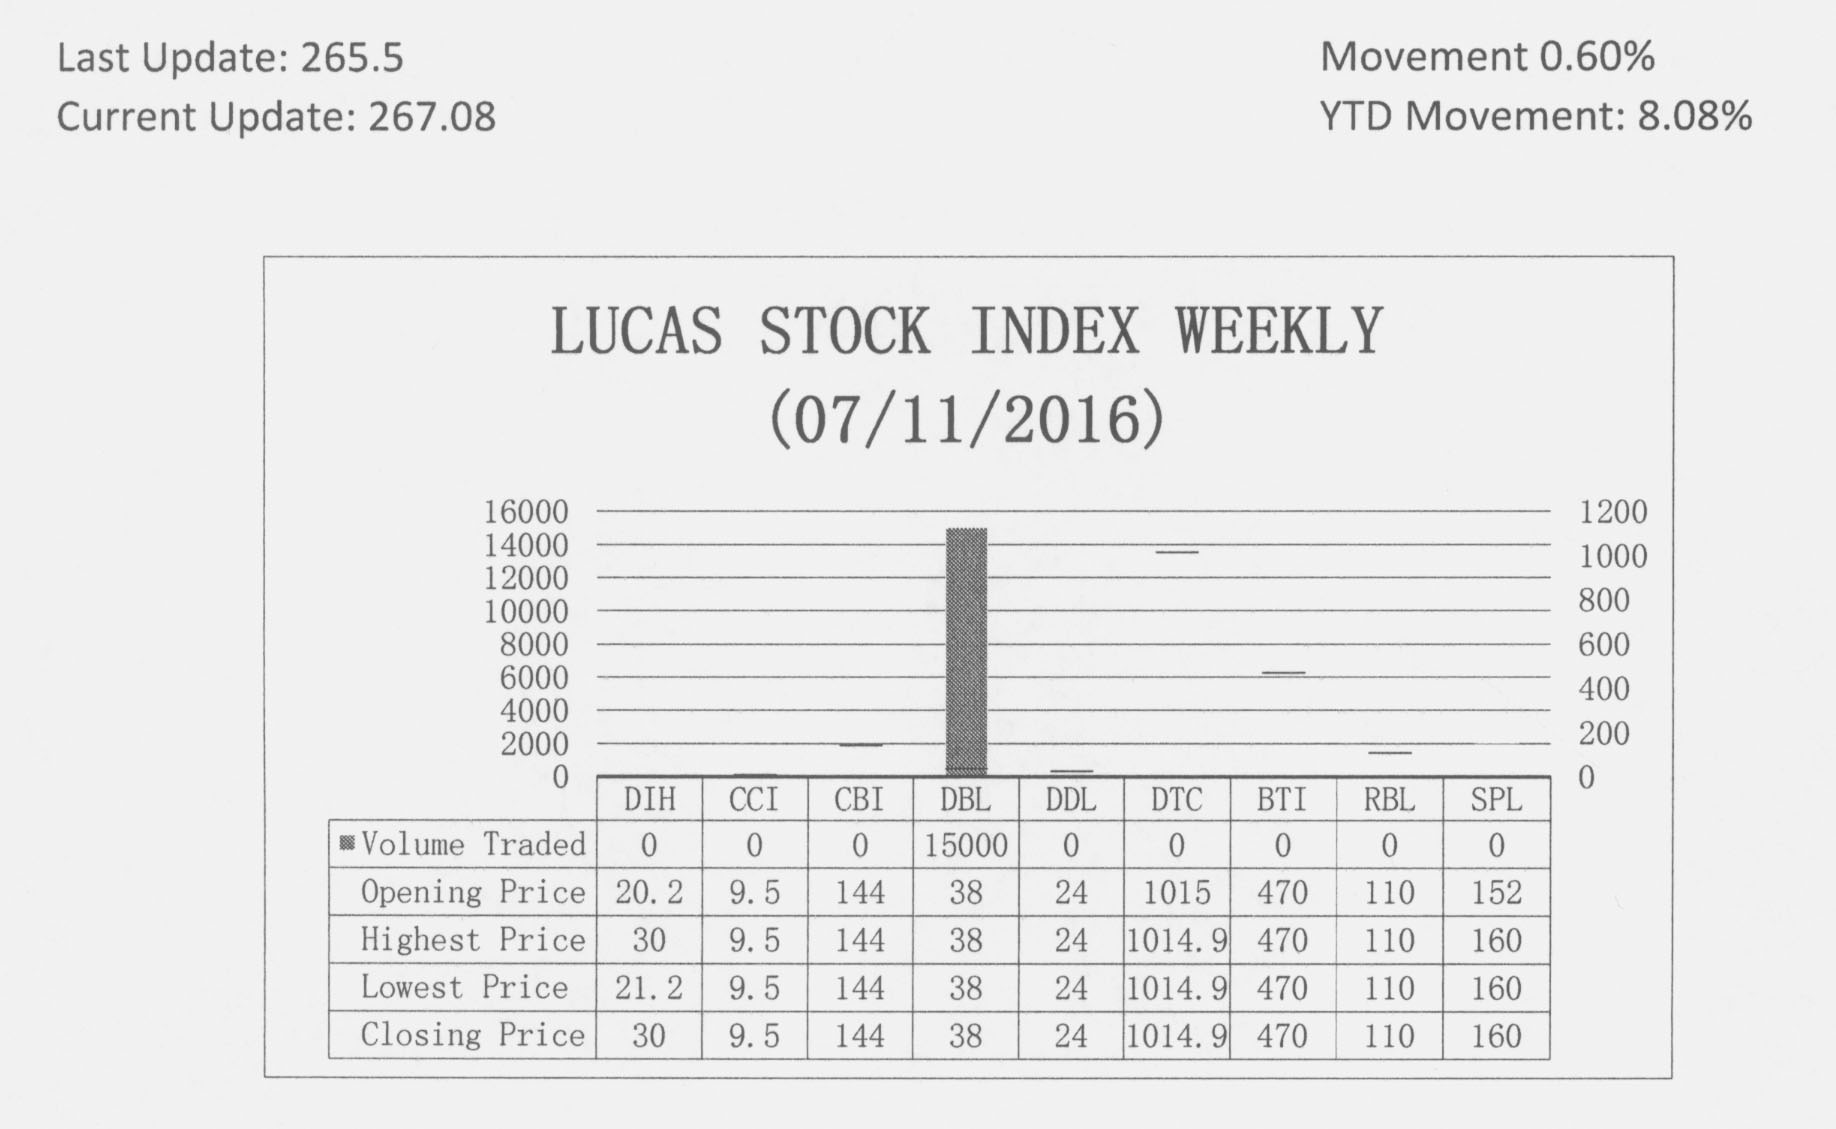
The likelihood of growth becoming stronger in the second half of the year might be reflected in the performance of the stock index that this writer produces. From January 2016 to the present, the index has risen 5.4 per cent. The index has shown sustained growth over the last six weeks giving the impression that the private sector is still optimistic about the prospects of the Guyana economy.
LUCAS STOCK INDEX
The Lucas Stock Index (LSI) rose 0.60 percent during the second period of trading in July 2016. The stocks of one company were traded with 15,000 shares changing hands. The traded stock also rose 5.56 percent as the only Climber.