Most important drivers
 Guyanese households spend the most money in the economy with the result that their spending contributes the most to the gross domestic output (GDP) each year. Spending by Guyanese households accounts for in excess of 60 percent of the output generated by the local economy. At that level of spending, they are the most important drivers of the economy. This occurrence is not unusual since most economies around the world depend heavily on the spending by households at least to drive economic growth if not to drive economic development. What they do with their money matters. Spending on domestic production is only part of the story. Guyanese households spend plenty money on consumer items that are not produced in the country. In the absence of data on inventory, one has to assume that the consumer goods that are imported each year constitute a reasonable approximation of the money spent annually on those items by households. The amount spent on imports might itself be an interesting story as the article suggests later on. That observation aside, this article seeks to present what could be termed the profile of the Guyanese household through the sources of revenue and their spending preference. In order to achieve this objective, the article will rely on a few tables which cover three principal sources of income, namely earned income, gifts and borrowed money. It hopes to reveal also an apparent willingness on the part of households to undermine their own welfare by “cutting off their nose to spite their face”. The article will be presented in two parts.
Anemic contribution
In this regard, it would, perhaps, be useful to begin by addressing the question of the disposition of households towards the consumer choices available to them. The choices of consumer goods to households are made possible through local production and imports. Many are aware that Guyana imports many consumer items which could be produced locally. The spending on consumer goods imported from abroad has raised concerns among many about its impact on local productive capacity and unemployment. These concerns have been raised in the context of the anemic contribution of the local manufacturing industry to the range of consumer choices. The manufacturing sector contributes about seven percent of the goods and services produced in Guyana. It is a percentage that has remained constant for several years now and it shows no signs of improving. When sugar and rice are excluded from the measure, the manufacturing sector contributes less than five percent to GDP. The ability of this sector to add value to the Guyana economy by creating employment, expanding consumer choices, acquiring or introducing new technologies and contributing to tax revenues is weakened by competition from imports. The preoccupation about this matter is real as could be seen from a series of relatively recent newspaper articles on the subject.
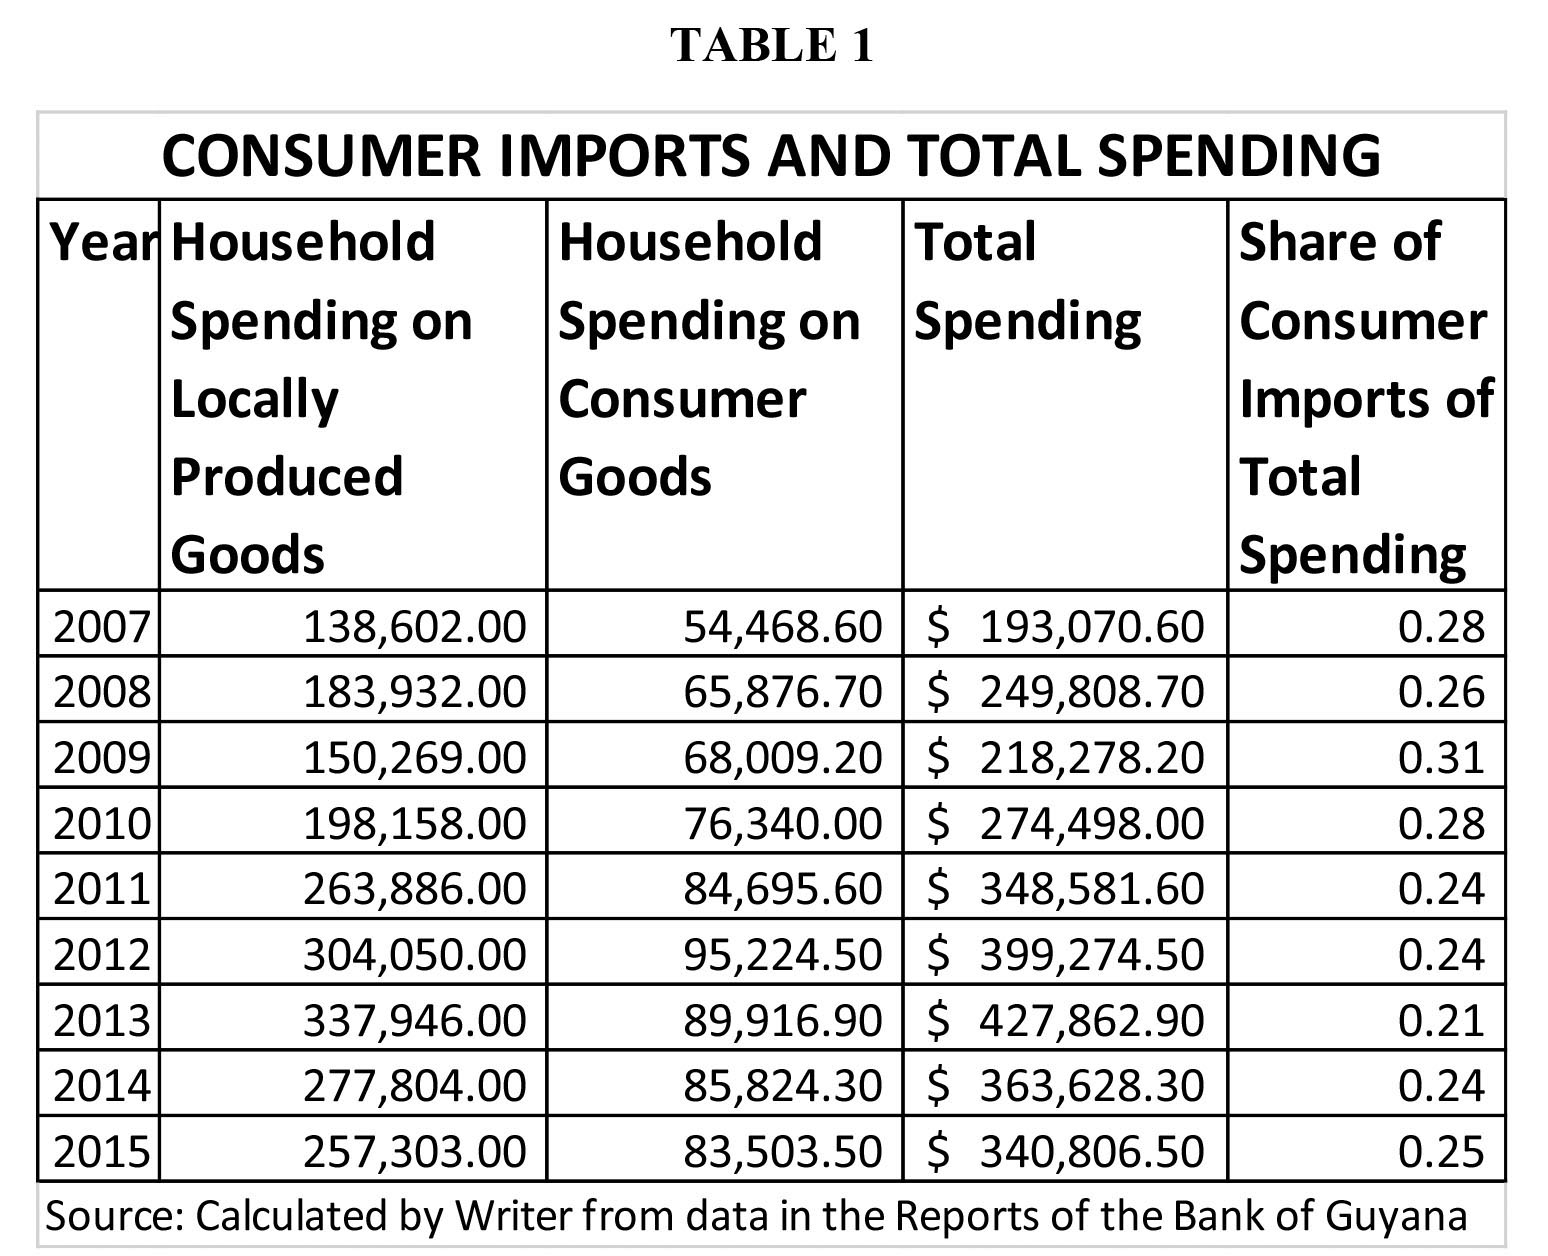
Evidence suggests that these concerns might be misplaced when one looks at the amount of money spent on imported goods by Guyanese households vis-à-vis the total amount of money spent by households on consumer goods. The data in Table 1 below reveals that an average of 26 percent of total spending is done on imported goods. In an effort to make the data on local and foreign goods compatible, spending on services was removed from local spending in order to approximate spending on goods only. Despite the openness of the economy, imports account for less than 27 percent of the money spent by Guyanese households and lead one to the conclusion that the bulk of the money is spent on locally produced items.
Incongruence
The belief though is that imports make up a much larger share of the money spent by households on goods. Indeed, had it not been for its impact on local manufacturing and employment, the claims that imports flood the local market would appear as much ado about nothing. So, what could be responsible for the incongruence between observations and the calculations presented herein? It is a question that ought to be answered to understand the problem. However, this article will not seek to do so, but would speculate that the import data presented below could be defective given the concerns about misclassification of customs declarations and the practice of under-invoicing by importers.
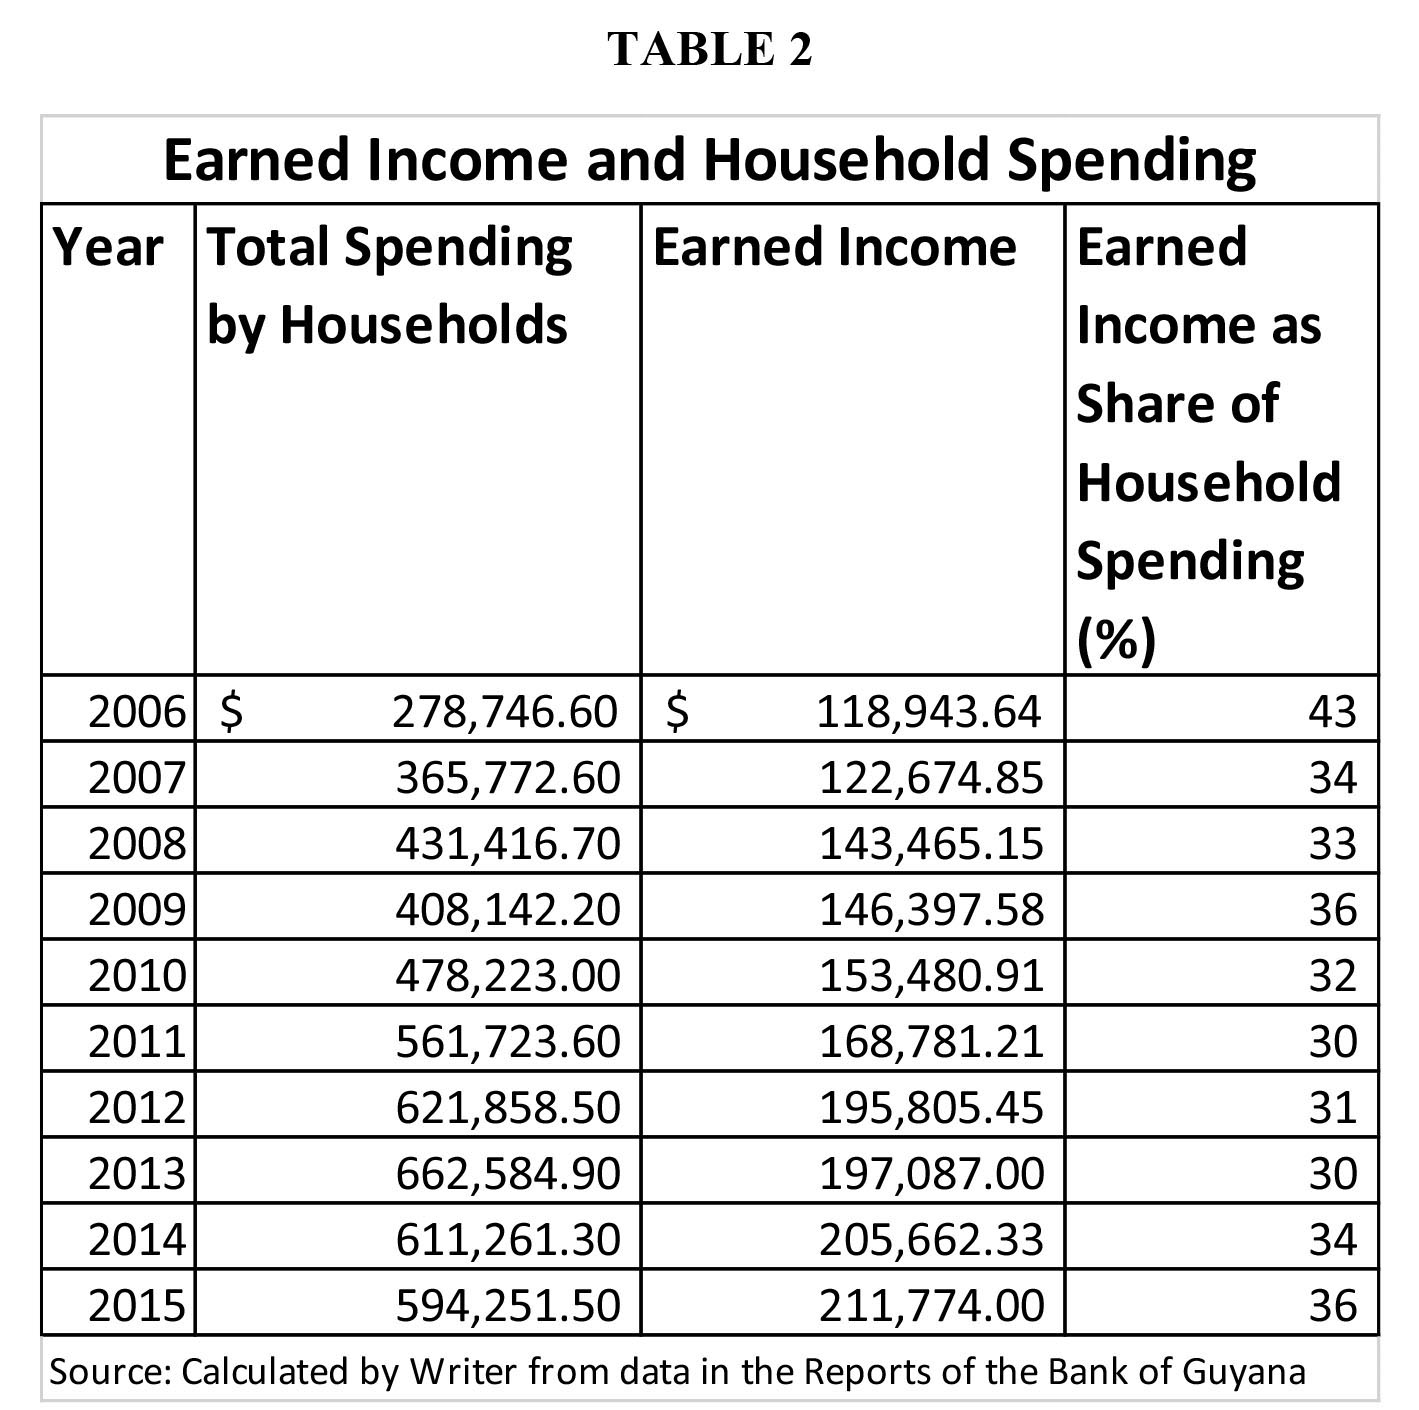
The spending by Guyanese households pulls one in the direction of the various sources of funds used to meet consumption needs. There are at least three explicable sources of funds used by Guyanese households. One source is earned income. The other two are remittances and borrowed money or loans. Many Guyanese work in both the public and private sector and get paid for doing so. They pay taxes which are calculated using the flat tax model, thereby relying on the official exemptions and nominal tax rate. The Government of Guyana has not been publishing unemployment statistics for the longest while. For several years, officials have remarked periodically that unemployment was in the range of 11 to 12 percent of the total labour force. The data about earned income which appears in Table 2 below is compiled partly on the basis of this assertion. This writer arrived at an annual approximation of the income earned by households by using the reported annual revenues from individual income tax, and working backwards with the exemptions, the associated nominal tax rates and an estimate of the employed workforce.
Raised eyebrows
The lifestyles of Guyanese households have raised questions about their source of income and spending levels. Readers can understand the reason for the raised eyebrows from the data presented in Table 2 above. The data reveals that income from work accounts for an average of 34 percent of the money spent by Guyanese households. Naturally, such a picture will lead people to wonder from where the rest of the income is coming. (To be continued)
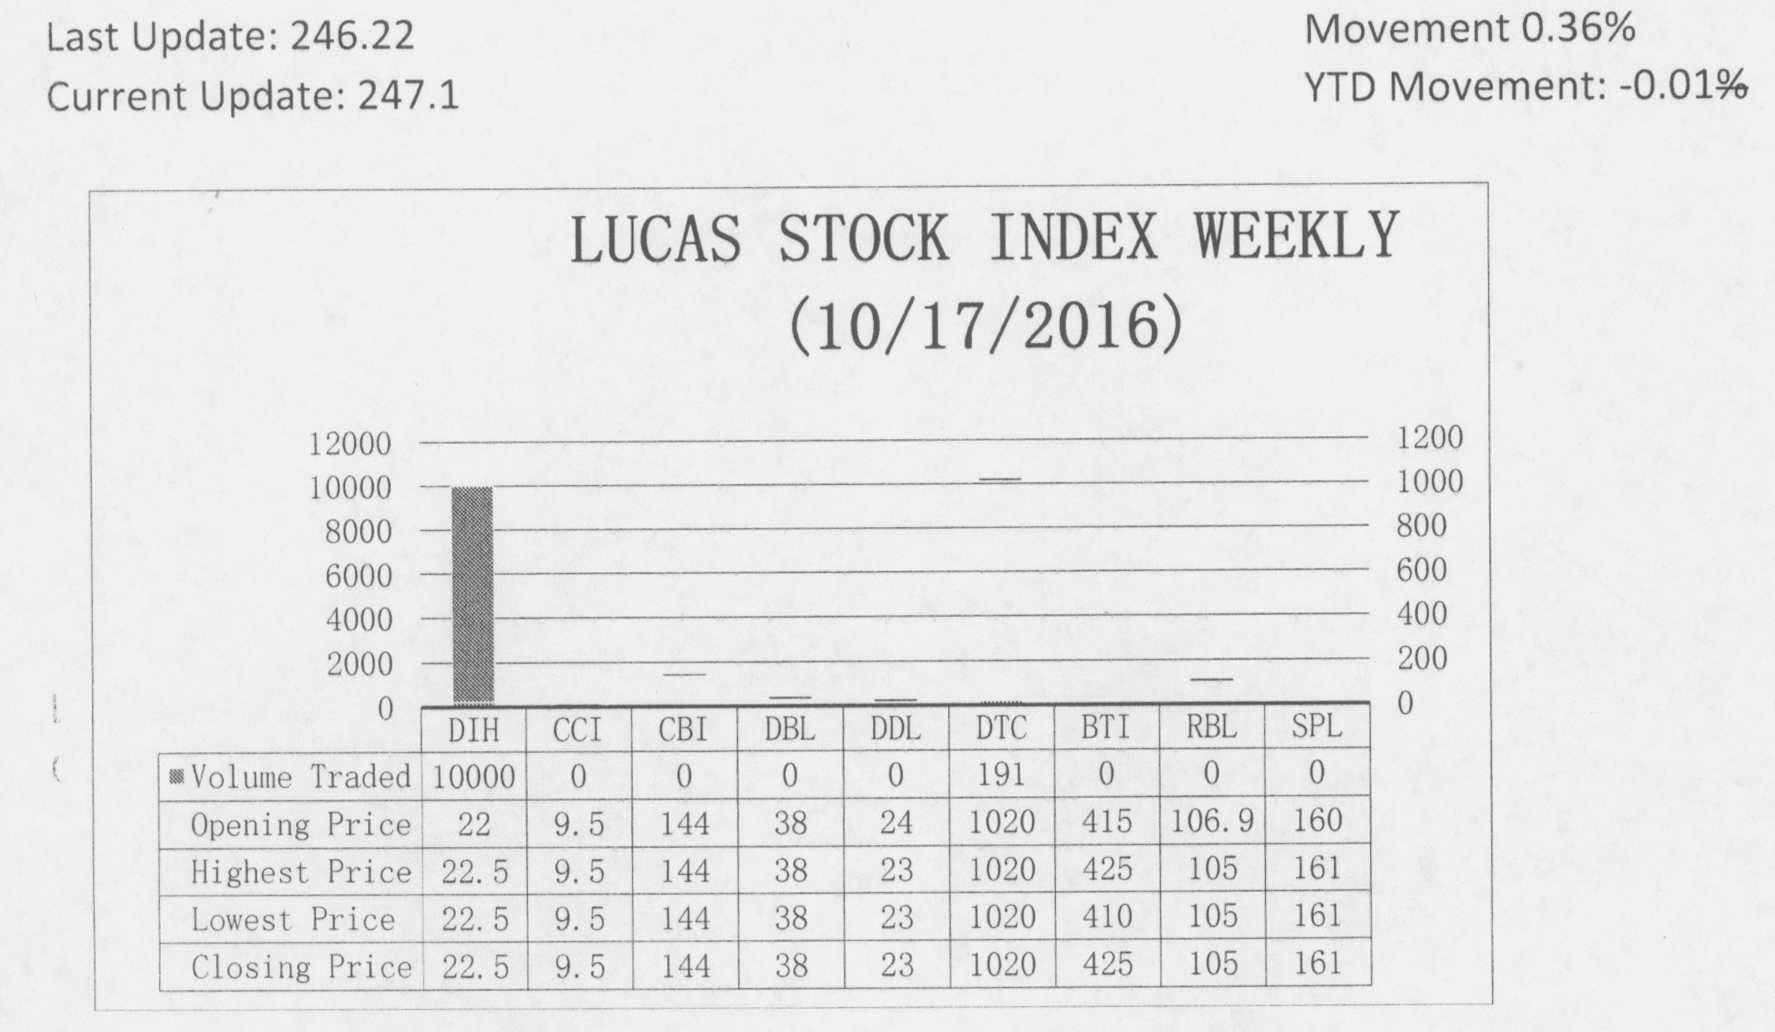
The Lucas Stock Index (LSI) rose 0.36 percent during the third period of trading in October 2016. The stocks of two companies were traded with only 10,191 shares changing hands. There was one Climber and no Tumblers. The stocks of Banks DIH (DIH) rose 2.27 percent on the sale of 10,000 shares. In the meanwhile, the stocks of Demerara Tobacco Company (DTC) remained unchanged on the sale of 191 shares.