 Complexity of industry
In an effort to gain a better understanding of how the oil industry works, we started examining its structure last week, using some of the methods that oil industry operators and analysts use. It was revealed that the industry is usually broken into two parts, namely the upstream and downstream operations. It was also observed that some analysts add one other component and that is the midstream operations which is a minimal set of activities between upstream and downstream operations.
The content of the upstream and midstream operations were described and discussed briefly. In addition, it was pointed out that the reserves were a key element in the determination of a country’s geo-political importance and an oil company’s power and influence in the oil market. The complexity of the oil market is also seen in the way oil is priced, including the use of technical variations that give rise to two well-known price benchmarks, namely Brent Crude and West Texas Intermediate. This week’s contribution will complete discussions about the structure of the oil industry, including the power structure that accompanies it. It will also discuss briefly the pricing of oil. Much of the presentation will rely on numbers.
Downstream activities are those activities that come after the discovery and production of oil. Once the oil and gas come out of the reservoir, something has to be done with them. It starts with transportation and then storage and then refining.
The refined product then has to reach consumers. This distribution need gives rise to demand for transportation and wholesale and retail outlets. Guyanese are more familiar with part of the downstream operations and items, namely inland storage, inland transportation and the wholesale and retail distribution of fuels, lubricants, cooking gas and kerosene. As one reads and hears about the things that are being done with the oil find, the more remote it seems that an oil refinery will be built in the early years of oil production or even longer in Guyana. Refining oil is a major part of downstream operations.
Oil refineries, it seems, tend to be placed in countries with a very high demand for oil. It is not surprising that large oil consuming or importing countries like the USA, China, Russia, Japan and India have some of the largest refineries in the world.
The USA is reported to have the largest refining capacity in the world and was capable of processing about 15 to 17 million barrels of oil per day. India, though fifth on the list, is reported to have the single largest refinery in the world with a processing capacity of 1.24 million barrels of oil per day.
Most likely place
Given that refineries tend to be driven by the demand for oil, where Guyana was concerned the need for infrastructure for refinery services does not appear to be immediate. The ExxonMobil refineries that are closest to Guyana are in the USA. Distance rules them out as locations to which oil from Guyana would be delivered. The most likely place any refinery to process oil from Guyana would be sited would be Trinidad and Tobago.
Such placement will help to strengthen ties between Guyana and its Caricom sister state. It should create opportunities for them to collaborate more on matters of common interest to the regional integration movement and to seek mechanisms to help increase intra-regional trade.
Notwithstanding the clarity with which Exxon presents its business story in its annual report, the broader story about the oil industry is not a simple one. Countries and companies are ranked as important in terms of the reserves that they have. In addition to discussing country profiles of individual countries, the tendency is to describe important oil economies in terms of their relationship to the Organization of Petroleum Exporting Countries (OPEC). As such, this article will provide data as it relates to the influence of OPEC where relevant.
Large deposits
Statistics kept by some official entities reveal that Venezuela has the most reserves in the world. Its oil equivalent reserves stand at an estimated 298.4 billion barrels of oil. Venezuela is followed by Saudi Arabia which is reported to have 268.3 billion barrels of oil in reserve. Among the top five countries with exceedingly large deposits are Canada, Iran and Iraq which have 171, 157.8 and 144.2 billion barrels of oil respectively.
Expanding the list to the top 10 countries with the largest reserves would result in countries like Kuwait with 104 billion barrels of oil, Russia with 103.2 billion barrels, the United Arab Emirates (UAE) with 97.8, Libya with 48.3 and Nigeria 37 billion barrels of oil being included in the list.
The USA does not feature in the top 10 countries with the largest reserves and some analysts argue that results from a flaw in the calculation of the reserves. Nevertheless, the USA, which is the largest consumer of oil, is not too far behind Nigeria with a reported 36.5 billion barrels of oil.
The political significance of oil reserves is often assessed in the context of the reserves held by the OPEC countries and those held by the non-OPEC countries. The OPEC countries control about 81 per cent of the reported oil reserves in the world while non-OPEC countries control the rest.
Narrow group
Access to the reserves influences the level of oil production. Quite a large number of countries produce oil but only 19 of them produce one million or more barrels of oil per day. Within this narrow group of countries, data show that the three top oil producers were Russia, Saudi Arabia and the United States of America (USA). Russia had a daily output of about 11 million barrels of oil per day while Saudi Arabia was producing an estimated 10.4 million barrels per day. The USA was the third largest producer of oil with an output averaging about 9 million barrels per day.
Completing the top five countries that are the largest producers are Iraq and Iran with an output of 4.88 and 3.99 million barrels per day respectively. Expanding the list to the top 10 oil producers would bring in China, Canada, UAE, Kuwait and Venezuela which produce 3.88, 3.83, 3.22, 2.84 and 2.27 barrels of oil per day. The remaining nine spots would be occupied by Brazil, Mexico, Nigeria, Kazakhstan, Angola, Norway, Algeria, Oman and the United Kingdom. The 19 countries account for about 71 per cent of global oil production.
Exporters
Assessments of the oil industry also take in the biggest exporters. Changes in production and exports can alter prices and hurt or help economic output. Countries pay close attention to who the big exporters are since it affects refining operations as well. The biggest exporters of oil are Saudi Arabia and Russia which together export 28 per cent of the oil reaching the shores of other countries in 2015. The top 10 exporters which included Iraq, UAE, Canada, Nigeria, Kuwait, Angola, Venezuela and Kazakhstan account for two-thirds of the world’s exports. Within this narrow group of exporters are seven members of OPEC who were responsible for nearly half of the world’s exports. In addition, four of the top 10 exporters are in the highly volatile Middle East.
The oil industry is just as concerned about which companies dominate the industry as they are about which countries can influence its economic affairs. Discussions about companies also look to see who leads the industry, who controls market share, who can increase shareholder value and which would cost the most if up for sale. New discoveries of oil spark interest around the world and help to shift the ranking of companies.
Data reveal that about 25 companies with headquarters in 13 countries control an estimated 55 per cent of daily world oil equivalent output. Seven of those companies are located in the USA while four of them are located in Russia. Three of the companies are in China and two are in Canada. The other nine companies are in Brazil, Colombia, France, India, Italy, Netherlands, Norway, Spain and the United Kingdom.
Biggest companies
Gazprom and Rosneft, the two biggest companies, are located in Russia and together produce the equivalent of 13.45 million barrels of oil per day. When joined by Lukoil and Surgutneftegas, the Russian companies are responsible for 17.34 million barrels of oil equivalent per day.
The third largest company is ExxonMobil which is responsible for producing an estimated 4.1 million barrels of oil equivalent per day. When Exxon’s output is combined with the other six US-based companies of Chevron, ConocoPhillips, Anadarko Petroleum, Devon Energy, Occidental Petroleum and EOG Resources, the US is responsible for a daily output of 11.05 barrels of oil equivalent. Other major contributing companies include BP of the UK, Royal Dutch Shell of the Netherlands and Petrobras of Brazil. They contribute 3.24, 2.95 and 2.55 per cent respectively to the oil equivalent barrels per day produced by the 25 major oil companies.
When one considers the enterprise value of these companies, the rankings change dramatically. The enterprise value reflects the amount an investor would have to put up to buy a company. Together, the companies are worth US$2.5 trillion.
The seven US companies account for the highest share of the value, 34 per cent, while the three companies from China are responsible for the next highest share of 20 per cent. In fact, the top five companies account for 77 per cent of the value of the companies with the Netherlands, Russia and France being responsible for nine, eight and six per cent respectively.
The data reveal also that some of the very large oil producing companies are among the cheapest to buy. For example, Gazprom which is the largest producer with 8.38 barrels of oil equivalent would cost an estimated US$84.3 billion.
In contrast, ExxonMobil which produces less than half of what Gazprom produces would sell for US$390 billion. Similarly, Rosneft which produces about 5.07 million barrels per day would sell only for US$72.5 billion as against Petro China which would sell for US$303 billion producing one million barrels less of oil equivalent.
Pricing One other element of the oil industry that readers ought to know about is the pricing of oil. Two descriptors are used frequently to quote oil prices even though others exist. One is Brent Crude oil prices and the other is West Texas Intermediate (WTI) oil prices. The name Brent could probably be explained by the peculiarities of the oilfields from which oil comes. What is known though is that Brent is used to price about two-thirds of world oil supplies.
The oil is the sweet light crude type which is extracted from the oilfields in the Atlantic Basin. The WTI which is the US benchmark for crude oil prices is also used to price sweet light crude oil that is deemed to be sweeter than Brent crude. The difference in sweetness and variations in supply and demand also cause the price for the two benchmarks to differ.
Lessons
The lessons about the oil industry are many, and Guyanese would have to begin learning about them fast if they were to feel comfortable in the favourable economic conditions that could emerge. One hopes that efforts to learn about the industry would start sooner rather than later.
LUCAS STOCK INDEX
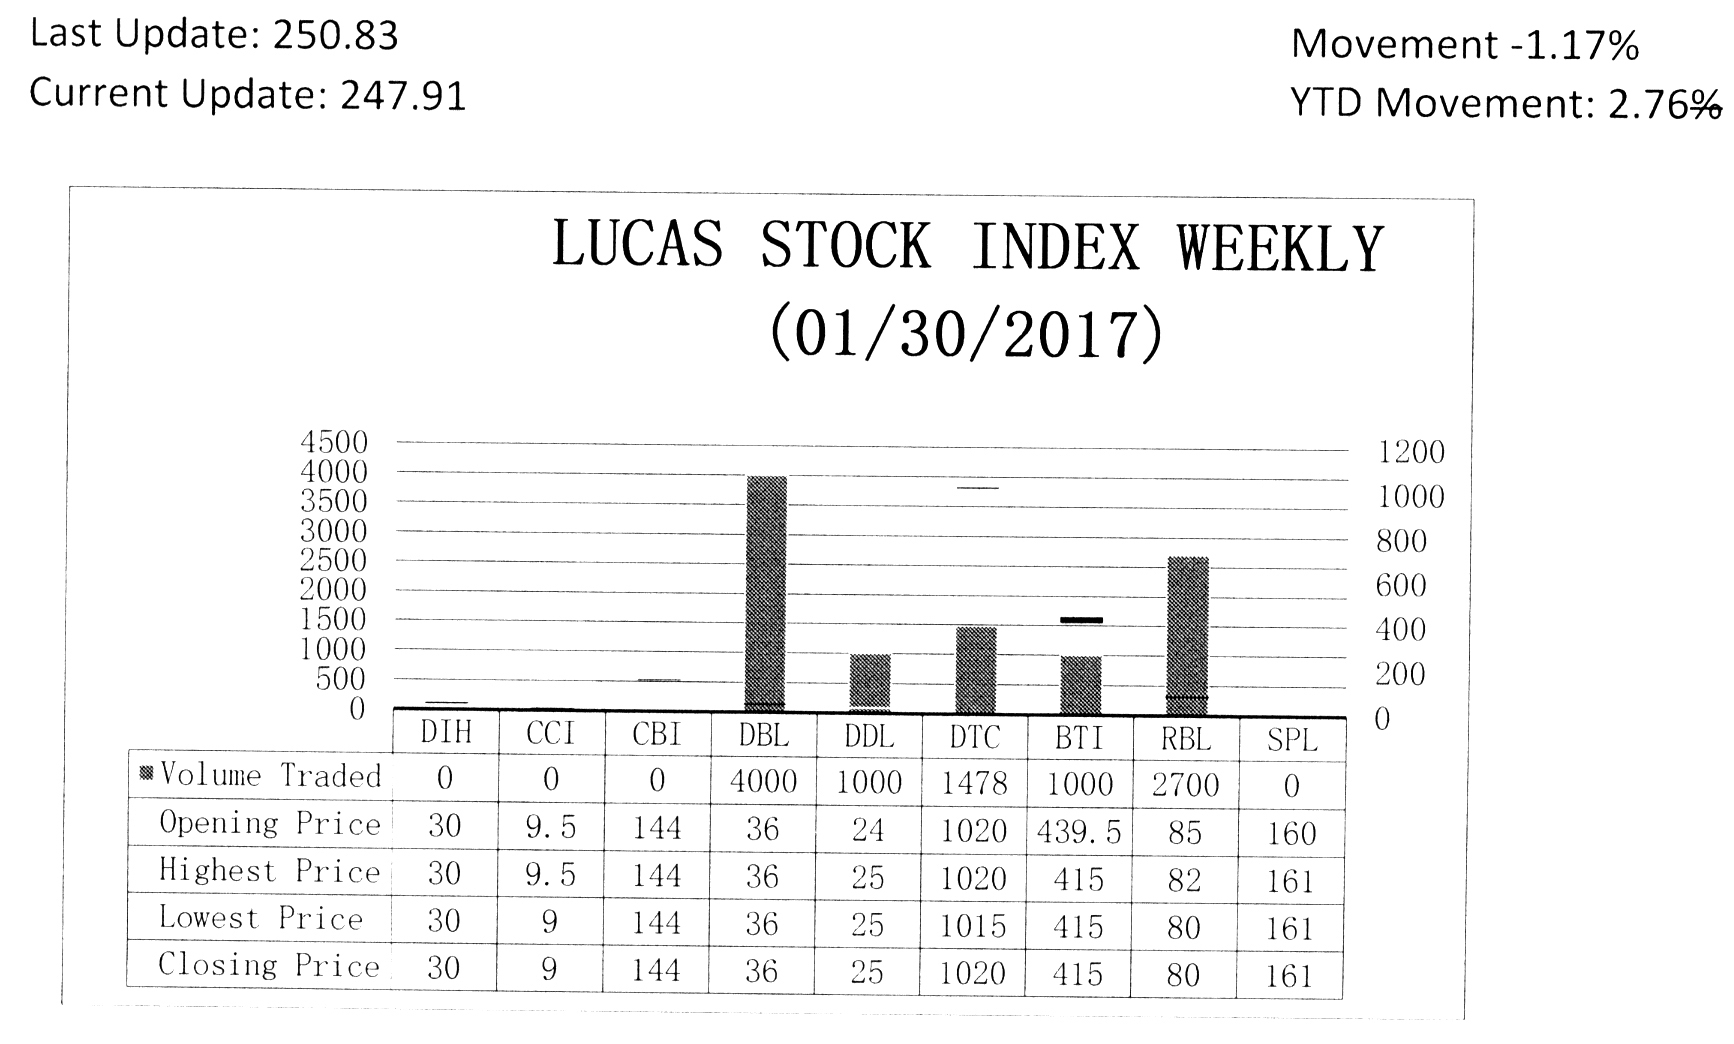
The Lucas Stock Index (LSI) declined 1.17 percent during the final period of trading in January 2017. The stocks of five companies were traded with 10,178 shares changing hands. There was one Climber and two Tumblers. The stocks of Guyana Bank for Trade and Industry (BTI) fell 5.57 percent on the sale of 1,000 shares while the stocks of Republic Bank Limited (RBL) fell 5.88 percent on the sale of 2,700 shares. At the same time, the stocks of Demerara Distillers Limited (DDL) rose 4.17 percent on the sale of 1,000 shares. In the meanwhile, the stocks of Demerara Bank Limited (DBL) and Demerara Tobacco Company (DTC) remained unchanged on the sale of 4,000 and 1,478 shares respectively.