Development Watch
By Tarron Khemraj
Introduction
This month marks ten years since Mr. Bharrat Jagdeo became President. I will dedicate this column to an analysis of several economic variables from 1999 to 2008. The indicators I have chosen are fundamental to the stability and well-being of a country. However, in order to perform a meaningful analysis of the President’s 10 years in office it requires that I compare the variables with other similar small countries like Guyana. I have chosen several sister CARICOM countries. The Caribbean Centre for Money and Finance (CCMF) has done a remarkable service by summarising the data on various Caribbean economies. I use the CCMF data for the Caribbean economies.

However, I believe it is important that we look at other small developing economies such as Botswana, Mauritius and Fiji. Mauritius and Botswana are seen as two remarkable success stories in Africa. On the other hand, Fiji is a small Island economy (sugar-based like Guyana) that suffered from ethnic and political conflicts during the period of analysis. For these non-Caribbean countries, I sourced my data from the World Bank’s World Development Indicators (WDI electronic access). For all the economies, I obtained foreign direct investment (FDI) data from the same WDI electronic access.
It is important to use other small economies like Guyana when performing such an analysis. First, the economies are all susceptible to global shocks and harsh world price conditions. These economies take world prices rather than make prices. Second, one country, Suriname, also suffered from significant floods like Guyana. Other Caribbean Islands like Jamaica and Grenada suffered immensely from the destruction by hurricanes. Third, these economies have a similar British historical legacy.
Some economists would argue that it is important to “control” for geography/location when making these cross-country comparisons. I believe the geography variable is covered by my small sample – Suriname is also on the South American mainland right next to Guyana; Belize is on the mainland of Latin America. But I want to make it clear that the purpose of this column is not to explain economic variations across these economies; rather the column summarises several economic variables in order to place the Jagdeo years in office into context. It will take a lot more than a 1,200 word column to explain the stylised variations.
Nevertheless, some readers would have observed by now that my thesis for Guyana’s underdevelopment is rooted in policy failures – both political and economic in nature. In other words, policy matters in my analysis. For instance, our policy makers at Office of the President (OP) have constantly failed to grasp the purpose of IMF and World Bank policies which they follow like model students without a second thought (Yes, did the Leninists at Robb Street ever once ask the OP planners where is the industrial strategy?) The policy tools of the Bretton Woods institutions are meant for short-term stabilisation and palliative (pain-relieving) poverty reduction. The task of long-term transformation still rests with the government and people of Guyana.
The development economics literature has several candidate explanations for variation in economic performance among countries. These include investment rates, the level of financial development, natural resource endowment, geography/location, institutions (property rights, historical origins, etc), and education and skills of the workforce. On the other hand, a formidable list of heterodox scholars has emphasised the importance of getting policies right (and not only prices). Therefore, in my opinion both economic and political policies matter – Guyana has failed since 1966 on both fronts. I will continue to develop this thesis over the coming weeks, but for now let us observe the data.
Before we move on, I report data on the EC Currency Union, which is made up of eight member countries: Antigua and Barbuda, Anguilla, Dominica, Grenada, Montserrat, St. Kitts and Nevis, St. Lucia, and St. Vincent and the Grenadines. The CCMF reports aggregate data for this sub-regional grouping.
Macroeconomic performance
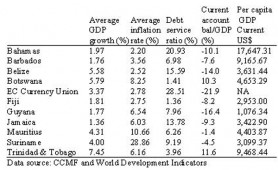
The average growth rate for the period 1999 to 2008 was calculated for each economy. This is reported in Table 1 below. The data revealed that only Jamaica and Barbados clocked a lower rate of growth over the ten years (there is a virtual tie with Barbados). However, this data should be interpreted with caution. The per capita GDP numbers show that Guyana is the least developed country in this list with an average for the 1999 – 2008 period of US$1, 076. Barbados and the Bahamas, while recording fairly lukewarm growth rates, have per capita GDP of US$9, 165 and US$17, 647, respectively. Both of these economies and most of the others (especially Mauritius) underwent important structural transformations through active policies since the early 1980s. It is well known that the rate of growth of an economy slows down the more developed it gets. However, Guyana is the poorest (on average) and grows at an anaemic average rate.
With respect to inflation, two countries recorded double digit inflation – Mauritius (10.66%) and Suriname (28.86%). All the others appear to have been quite stable from an inflation perspective as Guyana. Guyana has achieved a relatively low debt service ratio – that is the percentage of each export dollar spent on servicing the external debt. The significant debt relief Guyana received since 1996 has now reduced the debt service burden of the country. Significant amount of funds were released for social services, yet the country is still a mediocre growth performer. The point is the debt burden as an excuse ought not to be made for the mediocre performance over the past 10 years.
From a current account balance perspective, Guyana has the second most severe average deficit for the review period – minus 16.4% compared with the highest of minus 21.9% for the EC Currency Union. Remember, the current account balance measures how well the country is doing vis-à-vis the rest of the world.
Figure 1: Macroeconomic indicators – averages for the period 1999 to 2008
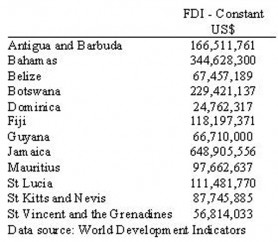
Table 2 reports average FDI inflows for the period 1999 to 2007 (note FDI data for 2008 are not available yet in WDI). Again I calculated the average over the period to make a comparison. It should be noted I could not obtain FDI data for the EC Currency Union as a whole. However, I am able to report this data for the following members – Antigua and Barbuda, Dominica, St. Kitts and Nevis, St. Lucia, and St. Vincent and the Grenadines. Guyana received more FDIs than two countries on the list – Dominica (US$24,762,317) and St. Vincent and the Grenadines (US$ 56,814,033).
Figure 2: Foreign Direct Investments (FDIs) – averages for the period 1999 to 2007
Conclusion
Once we strip away the PNC alibi and compare Guyana to its global peers of small open economies – which face the same global shocks – there is not much to shout about and celebrate. Also, as we saw last week “slow fiah, mo fiah” could not have been the only factor contributing to the post-1997 economic downturn.
You can send comments to: tarronkhemraj@gmail.com


