Dear Editor,
Over the years I have endeavored to point out how a particular genre of letter writers use inaccurate data to draw unjustified conclusions, but this unpleasant tendency continues unabated. I have come to the conclusion that either these letter writers try to deliberately obfuscate and confuse the issues and the general public or fail to recognize data inconsistencies and undertake a sound analysis. More likely, perhaps, it’s a little of both. I am prompted to make these observations again in relation to Mr Seepaul Narine’s piece titled ‘Detractors should take note of the success achieved by GAWU on behalf of workers,’ SN, December 9.
 “By the time Dr Cheddi Jagan… passed away in 1997, workers’ increase in pay had exceeded 300 per cent …” declared the General Secretary of GAWU. This conclusion was reached by simply summing the yearly increases in the daily minimum wage (DMW). Now the PPP came to office in late 1992 and I am not too sure if it can take credit for the pay increase in that year, unless, of course, one equates the PPP and GAWU. But there is another issue here: the General Secretary undersold his union, at least when the data is looked at in nominal terms.
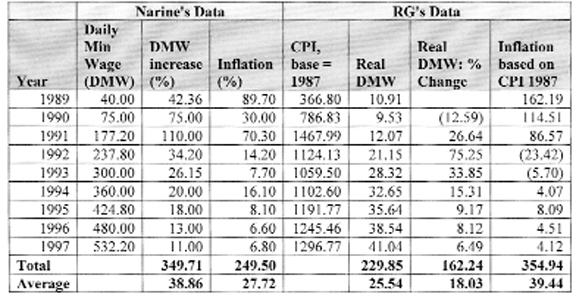
Instead of merely summing annual increases, it is more illuminating to look at the increase in the DMW from 1989 to 1997, which is a whopping 1,230 per cent! For 1990 to 1997, the increase was 609.6 per cent. As the period narrows, the increase in DWM also narrows. Thus, the increase from 1996 to 1997 is 10.9 per cent, as can be seen from the third column of the table in Mr Narine’s letter (reproduced in the accompanying table to this letter). I am puzzled, however, about why the General Secretary showed inflation rates in his table, as he did not link nominal DMW increase and inflation. Doing that would yield real DMW, which experienced a smaller increase than nominal DMW. At the overall level and based on his own data, if the DMW increased by 349.7 per cent and inflation was 249.5 per cent during the 9-year period, then the real increase is 100 per cent, which is considerably below 300 per cent.
When it comes to money, people are interested in what it can buy and not merely in the nominal amounts of money. In Germany by 1923, the wildest inflation in history was raging (technically known as hyperinflation). Often prices doubled in a few hours. A wild stampede developed to buy goods and get rid of money. By late 1923 it took 200 billion marks to buy a loaf of bread! This example, albeit an extreme one, illustrates why it is necessary to focus on monetary magnitudes in real terms. ‘Real terms’ take into account inflation, which eats away the value of your money, and refers to the actual command of money over resources. For example, if an egg cost $15 dollars in 1989 and $45 in 1997, then that same $15 can buy only one-third of an egg today. The purchasing power of your money has been eroded by inflation, which, other things being equal, drove up the price of an egg by 200 per cent – an egg today costs three times as much as it did in 1989.
Before proceeding, it is necessary to make two observations about the data on inflation. First, Guyana suspended the publication of the consumer price index (CPI) from about the mid-1980s to the early 1990s. Any data on inflation during this period are estimates only, and there are many estimates around. Second, the CPI is anchored to a base year (the year from which price increases are compared), and different base years produce different rates of inflation. Narine is silent on these issues. I do have a comprehensive data set on Guyana obtained from reputable sources, including a CPI series that goes back to 1948, with 1987 as the base year. We shall use this to look at the DWM in real terms; real DWM is obtained by deflating nominal DWM by the CPI to take account of inflation = (DWM/CPI)*100.
The result shows that real DMW was $10.91 in 1989, but rose to $41.04 in 1997, representing an increase of 276.3 per cent (and not 1,230 per cent in nominal terms). From 1990 to 1997, there was even a larger increase – 330.5 per cent. The increase in real DMW from 1996 to 1997 was 6.5 per cent. The conclusion is a simple one: the increase in real DMW was much less than the increase in nominal DMW. For example, the real DMW increased by an average of 25.5 per cent per year during 1989-1997 compared to an annual increase in nominal DMW of 38.9 per cent. The total of the yearly increases in real DMW during the period was 276.3 per cent; that for nominal DMW, 349.7 per cent. More details are in the accompanying table to this letter.
In this particular instance, I admit, looking at the DMW in nominal or real terms during 1989-1997 does not make much of a difference, which is perhaps a happy coincidence for the General Secretary. But my purpose was to question the data and methodology. The general rule is that when dealing with amounts expressed in monetary terms over a period of time, it is more fruitful to look at these magnitudes in real, rather than nominal, terms because inflation bites away the purchasing power of money.
Leaving aside the analysis of the data, the more important question is a novel one: did GAWU deliver a better standard of living to its workers? Could $41 per day buy material comfort, leaving aside satisfaction and happiness, for a single worker let alone for a family of about 4.28 persons – this was the household average size based on data from the Household Income and Expenditure Survey of 1992-93? The answer must be a resounding ‘no.’ If the question is about the ability of GAWU to continue to imprison its workers in abject poverty and hopelessness, the answer must be a resounding ‘yes.’ The analysis and conclusions derived from a given dataset are only as good as the dataset. Inaccurate data, unsound analyses and erroneous conclusions produce a picture that does not exist in the real world. A picture that does not depict the daily struggles and frustrations of people to feed, house, educate their families, and provide health services for them. So bragging about data vastly divorced from reality is another ploy to render the poor and vulnerable voiceless.
Yours faithfully,
Ramesh Gampat