
Part 3
Economic growth
As I bring this discussion on Guyana’s public debt behaviour since 2006 to an end, I direct attention to its broader macroeconomic context. Table 1 below portrays real economic growth as revealed by the 2006 rebased price series GDP estimates. Real growth has averaged over 4 percent per annum for the entire period, fluctuating between a high of 7 percent in 2007 and a low of 2 percent in 2008.Noteworthy, between 2008 and 2011 it has consistently increased by approximately one percentage point each year.
The strongest sustained growth has been in the services and construction sectors. Mining (mainly gold) has had two years of double digit growth and three years of negative growth. In comparison the performances of the agriculture/fishing/forestry and public administration sectors have been weak. The woeful performance of the sugar industry principally accounts for the weak outcomes of the agriculture sector.
Table 1: Guyana Value Added: Sectoral Contribution to Real Growth (at 2006 Prices)

Export performance
Over the period 2006-11, export performance has been very robust, doubling in value between 2006 (US$0.7 billion) and 2011 (US$1.4 billion). Indeed except for a decline in 2009, the annual percentage increases have ranged between 16 per cent and 26 per cent. As a share of GDP, exports have accounted for more than one half over the period 2006 and 2011.
Table 2: Guyana: Exports and GDP (US$ million)
Macroeconomic background
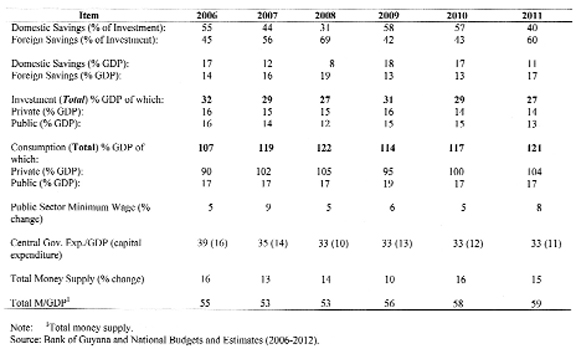
Table 3 below highlights the behaviour of key macroeconomic aggregates. There the following can be observed: first, the share of total savings in GDP has fluctuated between 27 per cent in 2008 and 31 per cent in 2006. Domestic saving had exceeded foreign saving as a share of GDP in 2006, but this was reversed by 2011. Second, total investment as a share of GDP has also been relatively stable, ranging from 27 per cent (2008 and 2011) to 32 per cent (2006).
Third, the share of consumption in GDP has ranged from 107 per cent in 2006 to 122 per cent in 2008. Private consumption accounted for the overwhelming bulk of this macroeconomic category, with public consumption averaging only 17 per cent of GDP. Fourth, central government expenditure as a share of GDP has ranged from 39 per cent (2006) to 33 per cent for the years 2008-11. Separately government capital expenditure has ranged between 16 per cent of GDP in 2006 and 10 per cent in 2008.
Table 3: Guyana: Macroeconomic Aggregates (Rebased National Accounts 2006 series)

Wages, prices, money supply
The behaviour of two other macroeconomic variables shown in Table 3 above is worth noting at this stage, namely, 1) the public sector minimum wage and 2) changes in the money supply. The public sector minimum wage rate changes are further compared below with price level changes in Table 4. There it can be observed that the announced increases in the annual minimum wage for public sector employees marginally exceeded (1.4 per cent) the rate of price inflation for the years 2006 to 2011.
Over the same period, however, the rate of increase in the money supply has been high; more than three times the growth of GDP at times and averaging 14 per cent per annum.
Table 4: Price level and Minimum Wage (% change)

Next week I shall wrap-up this discussion of Guyana’s public indebtedness since 2006.