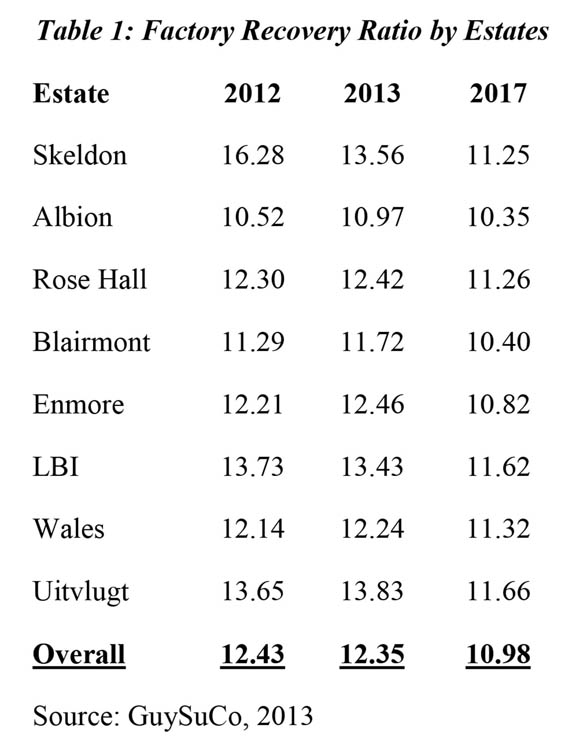
This week I begin with a wrap-up discussion of factory performance measures as revealed at the level of the eight individual estates. The available data for 2012, 2013, and 2017 are shown in Table 1.
That data reveal the familiar patterns observed in the other performance measures. First, the Berbice estates as a group outperform the Demerara estates. The exception to this is the special case of Skeldon, where the highest amount (16 tonnes of cane) was required to produce one tonne of sugar in 2012. Second, Albion is the best performing factory, with 10.52 tonnes of cane required per tonne of sugar in 2012. Third, all the Berbice estates, (other than Skeldon) perform better than the industry average, of 12.43 tonnes cane per tonne sugar. Like Skeldon, two Demerara estates (LBI and Uitvlugt) also perform very badly, requiring as much as 13.65 and 13.73 tonnes of cane respectively to produce one tonne of sugar.
 The variability in performance across the estates’ factories is a cause for concern; notably, the Skeldon project which was conceived as the lynchpin of a major effort to improve factory performance, increase the scale of sugar output, and generally modernize the industry. This project has failed catastrophically.
The data also show that in 2012 grinding in the various factories had varied from 25.11 weeks in Wales to 39.05 in Blairmont. Indeed the factory ‘thru-put’ for the new Skeldon factory was originally targeted at 350 tonnes cane per hour on completion, but it had only managed 196.29 tonnes cane per hour in 2012 and is forecast at the end of the Strategic Plan period to reach just 300 tonnes per hour. Readers should consider in this regard that there are no other major structural enhancements projected for the other factories during the Strategic Plan period 2013-2017.
Combined performance indicator
This leads to consideration of the last of the intended six performance measures. That measure combines factory performance (that is the recovery ratio or tonnes cane per tonne sugar) and the land productivity ratio (that is the sugar cane yield per hectare of harvested land). This combination results in tonnes sugar (TS) per hectare of harvested land (HA), which is perhaps the most common, and indeed widely acclaimed, measure of a sugar industry’s efficiency (TS/HA).
As I have done before in the cases of land productivity and factory recovery, I start by indicating the behaviour of this combined productivity measure for the decades of the 1990s and 2000s. Table 2 reveals that the sugar yield during the 1990s had averaged 5.64 tonnes per harvested hectare and for the 2000s this average was slightly higher at 5.91 tonnes per hectare. Both these yields are low, whether compared with other sugar producing countries, or indeed with what prevailed in Guyana five decades ago. Thus in 1960 the sugar yield in Guyana was 8.40 tonnes per hectare, or about 40 per cent higher than what is current or indeed forecast over the next five years of the Strategic Plan period!

Source: GuySuCo Annual Reports (various years)
Because of its agricultural base, it is to be expected that sugar production and productivity would exhibit annual variations. During the 1990s, sugar yields had ranged from a low of 3.46 tonnes of sugar per hectare in 1990 to a high of 6.83 tonnes in 1996. During the 2000s, the comparable range was from a low of 4.75 tonnes of sugar in 2008 to a high of 7.29 tonnes in 2002. The mean absolute deviation in sugar yields was 0.65 for the 1990s and 0.64 for the 2000s. The variations over the two decades therefore, were quite modest, as the Graph below illustrates.

Recent combined indicator
Finally, Table 3 provides information on the behaviour of the combined performance measure for recent years and the forecast for 2017 in the Strategic Plan. It should be observed that for the Plan period (2013-2017) des-pite forecast improvements, low sugar yields are expected to persist. As earlier indicated this is emphatically the case when these yields are
compared with those of much earlier years.

Source: GuySuCo, 2013.
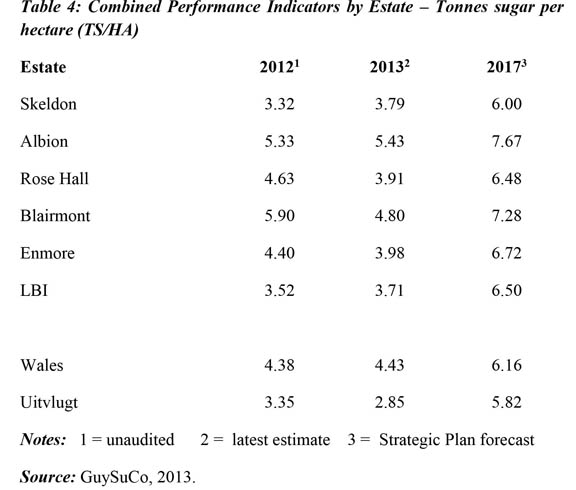
To complete this discussion, the available data for individual estates are revealed in Table 4. Generally, the previous patterns observed in the cases of land productivity and factory performance are repeated. Thus, the Berbice estates (except for Skeldon) perform better than the Demerara estates, with two (Albion and Blairmont) forecast to exceed 7 tonnes of sugar per hectare in 2017. Further, the worst performing estate is Uitvlugt.
Source: GuySuCo, 2013.
At the end of this weeks-long examination of six key performance measures in sugar, sadly they are all disappointing thereby underscoring the depths of distress in Guyana’s sugar industry.