Introduction
The Bureau of Statistics’ (BoS) Preliminary Population and Housing Census Report for 2012 announced a decline in the population from 751,223 persons at the 2002 Census to 747,884 persons. This created a political and economic bombshell of no mean order. Since that publication, I have been bombarded with queries from intrigued citizens. Most focus on seeking my estimation of what the population should have been in 2012, if population events over the intercensal period (2002-2012) had been “normal.” Today’s column offers a response to this questioning.
A word of caution, such questions implicitly attribute the population decline to outward emigration in the decade of the 2000s. I find this plausible, although the 2012 Preliminary Report does not examine fertility, mortality or death rates. When a similar decline in the population was identified for the first time in Guyana’s census history in the 1991 Census, the BoS indicated that this outcome was “consistent with the peak emigration flows recorded during the decade of the 1980s.”
Readers are also reminded the 2012 Report is preliminary; changes in the information presented in the Final Report could differ, as hashappened before. Thus the Preliminary and Final Reports for the 2002 Census reported the population size as 749,190 and 751,223 respectively, which is a variation of 2,133 persons.
 Today’s column is dedicated to estimating what might have been the 2012 population size, if the intercensal emigration outflow had been “normal.” Next week I shall pursue other matters contained in the Preliminary Report.
The report’s coverage
The report provides preliminary data on population size, density, areal and gender distribution, households, buildings and dwellings. These are presented for all Guyana and the regions. The Final Report should contain further analysis of these topics, as well as analysis of other demographic and socio-economic features, including age and ethnic distribution; education; fertility and mortality patterns; labour force participation; migration; and disability.
Further background information is presented in Schedule 1, which gives the population size for the 1921 to 2012 censuses.
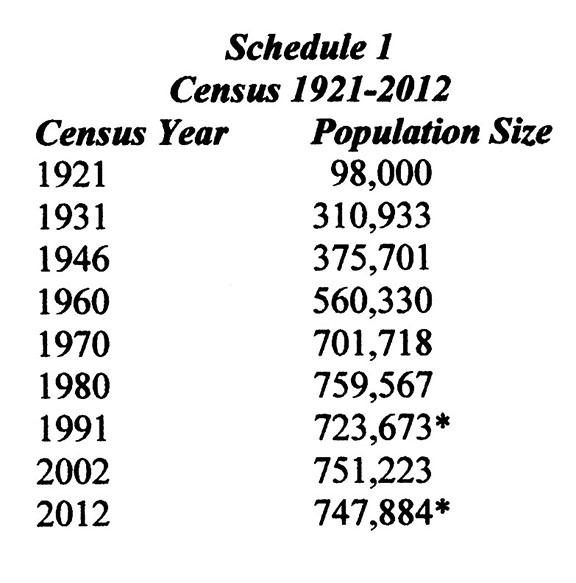
Note * = decline
Source: Bureau of Statistics 2014
There have been several considered statements on the 2012 Preliminary Report, including those of the former editor of Sunday Stabroek ‘Business Page’ (Christopher Ram); the present editor (Rawle Lucas); columnist (Ralph Ramkarran); and, the Development Watch columnist (Tarron Khemraj). Conveniently all of these have appeared in Stabroek News. There has also been a release by the Indian Arrival Committee (IAC), which used Singapore’s performance to compare with Guyana and expressed extreme alarm at the population decline, drawing the widely-supported inference that “exceptional net outward emigration” was the cause.
‘What should have been?’
It is impossible to establish to a significant degree of accuracy a figure that represents what would have been the population size in 2012, if “normal” population events had occurred. Because of this, my preference (as presented here) is to simulate a range of likely values of this figure, based on simple, transparent, straightforward, and explicit assumptions. This would allow readers to choose from among the simulations or stick to expressing their view as a range of likely outcomes. My preference is for the latter.
Schedule 2 displays the resulting values for the 2012 population size after the simulations.
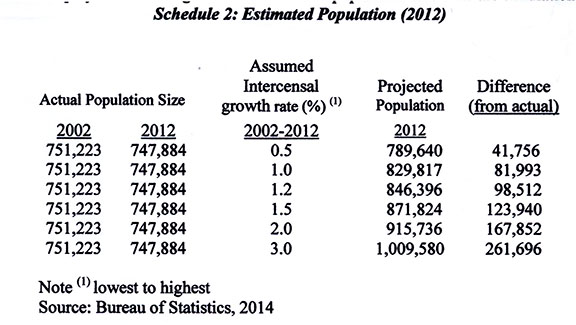
Six population growth rate estimates for the intercensal period 2002-2012 are assessed: 0.5; 1.0; 1.2; 1.5; 2.0 and 3.0. All are higher than the revealed intercensal growth rate of (minus) -0.04 per cent and also the population growth rate of 0.03 per cent for the years of the PPP/C administration, 1991-2012. (This growth rate would require about two and one-third centuries for Guyana’s population to double!)
Further, because the simulation is based on the intercensal period 2002–2012, this does not reflect population events before then, which might have resulted in a larger estimated size for the 2012 population. The Schedule also does not present the results on an annual basis over the period because this would have dramatically increased the data volume in the column.
The question to be asked is: why were those six growth rates chosen? Firstly, worldwide information suggests the population growth rate without exceptional migration for Guyana-type countries falls between a minimum of 0.5 – 1.0 per cent and a maximum of 3.0 – 4.0 per cent. Second, the rate of 1.2 per cent is based on two considerations. One is that this rate is conservative in that Guyana’s long-term population growth rate (between the end of World War II and the New Millennia 1946-2002) was 1.2 per cent. (Readers are familiar with the high emigration rates during the 1960s). The other is that the world population growth rate is presently 1.2 per cent. Third, 1.5 per cent falls on the mid-point and median rate from among those I have chosen. Fourth, the choice of 2.0 per cent reflects the typical (modal) rate for most small states. Finally, the choice of 3.0 per cent represents a conservative upper limit of historically recorded population growth rates. Sustained rates in excess of 3.0 per cent are relatively rare.
Based on these considerations the simulations suggest that exceptional population events (primarily emigration) account for a shortfall of between 42 thousand and 262 thousand persons at the time of the 2012 Census. This represents a percentage shortfall in the range of 6 to 35 per cent of the Preliminary Census population. Put another way, the census population should have fallen in a range of 790,000 to 1,009,000 persons without exceptional emigration.