Inequality results
As indicated, this week I begin with reporting the key results of official studies that sought to measure inequality and poverty in Guyana. As also previously indicated the 2006 Household Income and Expenditure Survey (HIES) still remains the most recent available official study of these topics. In my last column I had joined others (including the Inter-American Development Bank, (IDB)) in lamenting this depressing condition of the country’s social statistics. Parenthetically, I should also inform readers that the 2006 HIES was not explicitly designed as a poverty study; however, such types of large-scale spending and household surveys have been used several times before in other countries for this purpose, when direct poverty and inequality surveys were not available.
As I also noted previously, the most widely used measure of income/consumption inequality worldwide is the Gini Coefficient. Readers should therefore know that this coefficient is given on a scale of 0 to 1, where 0 represents perfect equality; that is, a situation where everyone in the measured statistical population obtains the same income, welfare, or value of income/consumption. When the value of the Gini Coefficient is one (1) the scale indicates a situation where one person gets all the income, welfare, or value of consumption and the others get none.
The 2006 HIES used household consumption as the proxy measure for income and welfare. That survey revealed a Gini Coefficient of 0.35 for all Guyana. This value compares to 0.44 obtained from the World Bank’s Living Standards Measurement Survey in 1992 and 0.413 obtained from the United Nations Development Programme’s (UNDP) Guyana 1999 Survey of Living Conditions. Thankfully, the trend manifested in this comparison is one of moderating income/consumption inequality between 1992 and 2006.
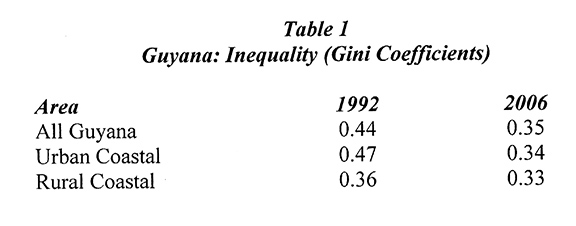
 The Gini Coefficient information for Guyana is also available by geographic area. The geographic data reveal that the Rural Interior area has had the highest inequality with an index of 0.38 (above the national index of 0.35} and the Rural Coastal area has had the lowest index with a value of 0.32. The Urban Coastal area stood at 0.34, which was just below the national average. These data are captured in Table 1.
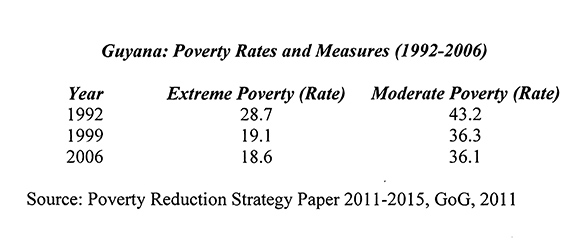
Source: Poverty Reduction Strategy Paper 2011-2015, GoG, 2011
When the data are classed as percentile shares of total consumption for the sampled households, they revealed that the richest 20 per cent (quintile) of the households obtained as much as 42 per cent of total consumption, while the poorest 20 per cent (quintile) obtained only seven (7) per cent of the total consumption. Indeed, the survey further showed that the poorest 20 per cent of households would have required an additional 42 per cent of the value of the moderate poverty line of US$1.75 to get out of poverty, while the next poorest 20 per cent would have required 14 per cent of the poverty line to escape poverty. Of course it was found that the top three quintiles (or the richest 60 per cent) were all above the poverty line.
Worldwide, during the first half of the 2000s the revealed pattern has been for the Latin America and Caribbean Region (LAC) to have the world’s worst inequality indicators. However, in 2006 Guyana was not in this category. Further studies are however needed to test if the trend from the late 1990s to the mid-2000s has been sustained for Guyana. The LAC region’s average coefficient was 0.48 in the mid-2000s compared to 0.31 for rich countries; 0.35 for Eastern Europe and Central Asia; 0.39 for the Middle East and North Africa; and, 0.44 for sub- Sahara Africa
Poverty results
As was noted for Guyana two poverty lines have been established on the basis of 1) information supplied by the Caribbean Food and Nutrition Institute (CFNI), and 2) that obtained from the 2006 HIES survey itself on the ratio of non-food spending to total spending. The CFNI set the food basket of necessary caloric consumption to ensure an adult male does not face extreme poverty. This basket was costed at US$1.25 per day at 2006 prices. To this was added from the survey of non-food spending observed in the HIES an estimate that determined the moderate poverty line. This was set at US$1.75 per day at 2006 prices and thus indicated the moderate poverty line, which included both food and non-food spending.
Based on this, the national moderate poverty rate obtained from the 2006 HIES was calculated at 36.1 per cent for the Guyanese population. This figure is also known as Guyana’s headcount measure of poverty. It compares with the similar estimate of 36.3 per cent obtained from the UNDP’ s Guyana 1999 study and the earlier World Bank’s 1992 study estimate of 43.2 per cent. The critical poverty rate was estimated at 18.6 per cent in 2006 and 19.1 and 28.7 respectively in the UNDP 1999 study and the World Bank’s 1992 study. These data are shown in the Table 2 below.
Conclusion
While the headcount measure of poverty is perhaps the most commonly known indicator rate of poverty, it embodies a very important anomaly. Thus for example, the headcount rate could remain the same (let’s say 30 per cent) for two different years but the extent or depth of poverty in households or for individuals could differ quite significantly. At the same percentage of the poor, one situation could represent greater poverty for those who are below the poverty line than in the other.
Next week I shall address this anomaly as I continue with my presentation of the results for inequality and poverty measures in Guyana. There I shall reveal measures designed to correct for the anomaly pointed out above.