Functions
The tax structure is used to collect the revenues that the government utilizes in its programmes, and is a function of the historical experience of the country. As noted in Part I of this article, several of the taxes that make up the tax structure were enacted and implemented long before Guyana became independent. The tax structure is also a function of the structure of the economy. An economy with a bias towards foreign trade will most likely emphasize taxes  that impact imports or exports. In Guyana imports make up about 62 per cent of the economy and as will be shown later bring in a meagre amount of revenue. This situation might be a result of the economic policy of the country, but it is a cause for alarm. In addition, the tax structure is a function of the trade and investment situation of the major trading partner of a country.
Table 1 below shows the trend in revenue collection in Guyana from 2006 to 2014. It reveals that revenue has been increasing every year during the period in review. If the base year of 2006 is used, it shows that revenues have increased over 132 per cent from 2006 to 2014.
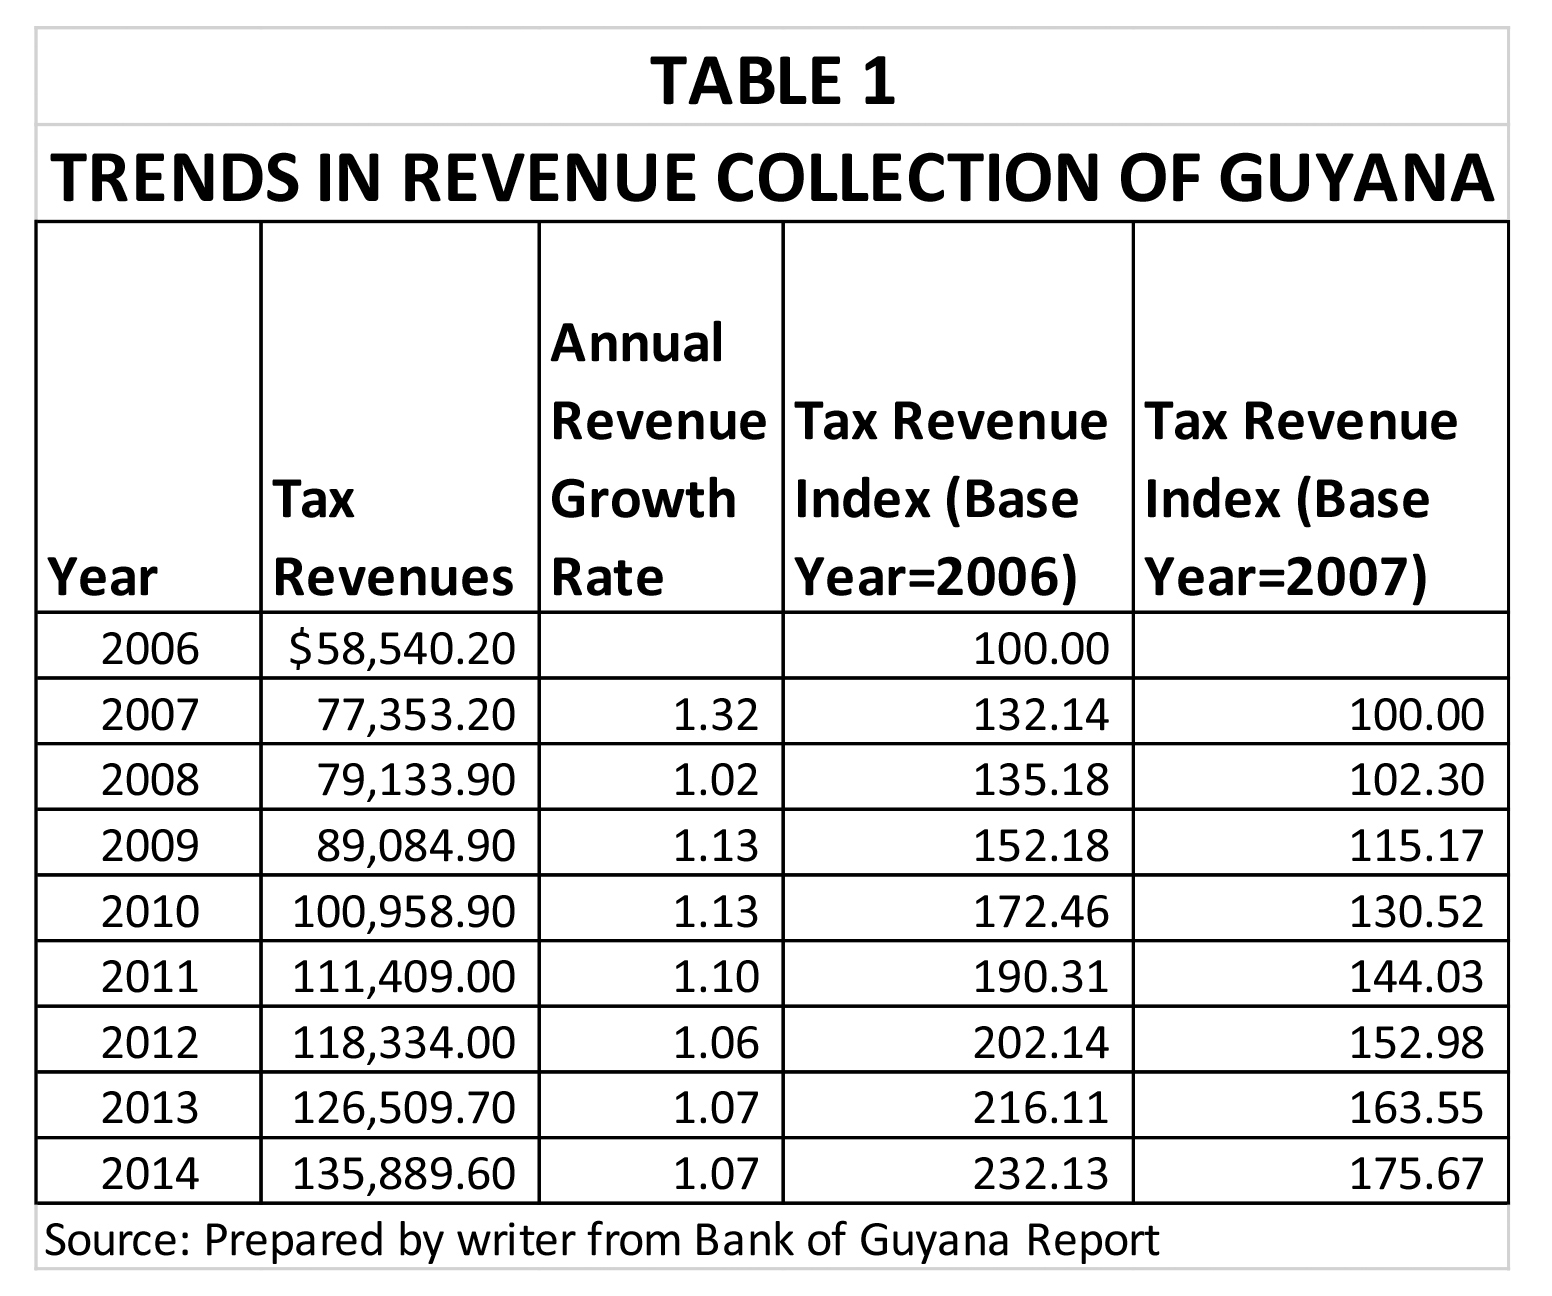
Both 2006 and 2007 were special years. The base of the economy was expanded in 2006. As a result many activities which were excluded from being counted in the economy were included. In addition, the tax structure was modified at the beginning of 2007. The value-added tax (VAT) was introduced and about six or seven taxes were dropped from the structure. The expansion of the base and the introduction of the new tax resulted in the substantial increase of 132 per cent in the revenues in 2007. When 2007 is chosen as the base year, the revenue increase is far smaller reaching only 75 per cent.
Behaviour of revenues
The rate of increase in revenues from 2008 also reveals its own story. After an increase of two per cent in 2008, revenues went up by 13 per cent in 2009 and 2010. Thereafter, revenue growth languished in the single digits. Even more, revenues began to increase at a decreasing rate before stabilizing at seven per cent in 2013 and 2014. This behaviour of revenues raises several concerns. It should be noted though that changes to the exemption threshold and the tax rates of three components, namely the income, company and property taxes were lowered and would have contributed to the decline in the tax rate. This writer believes that there are other reasons.
Compared to budget
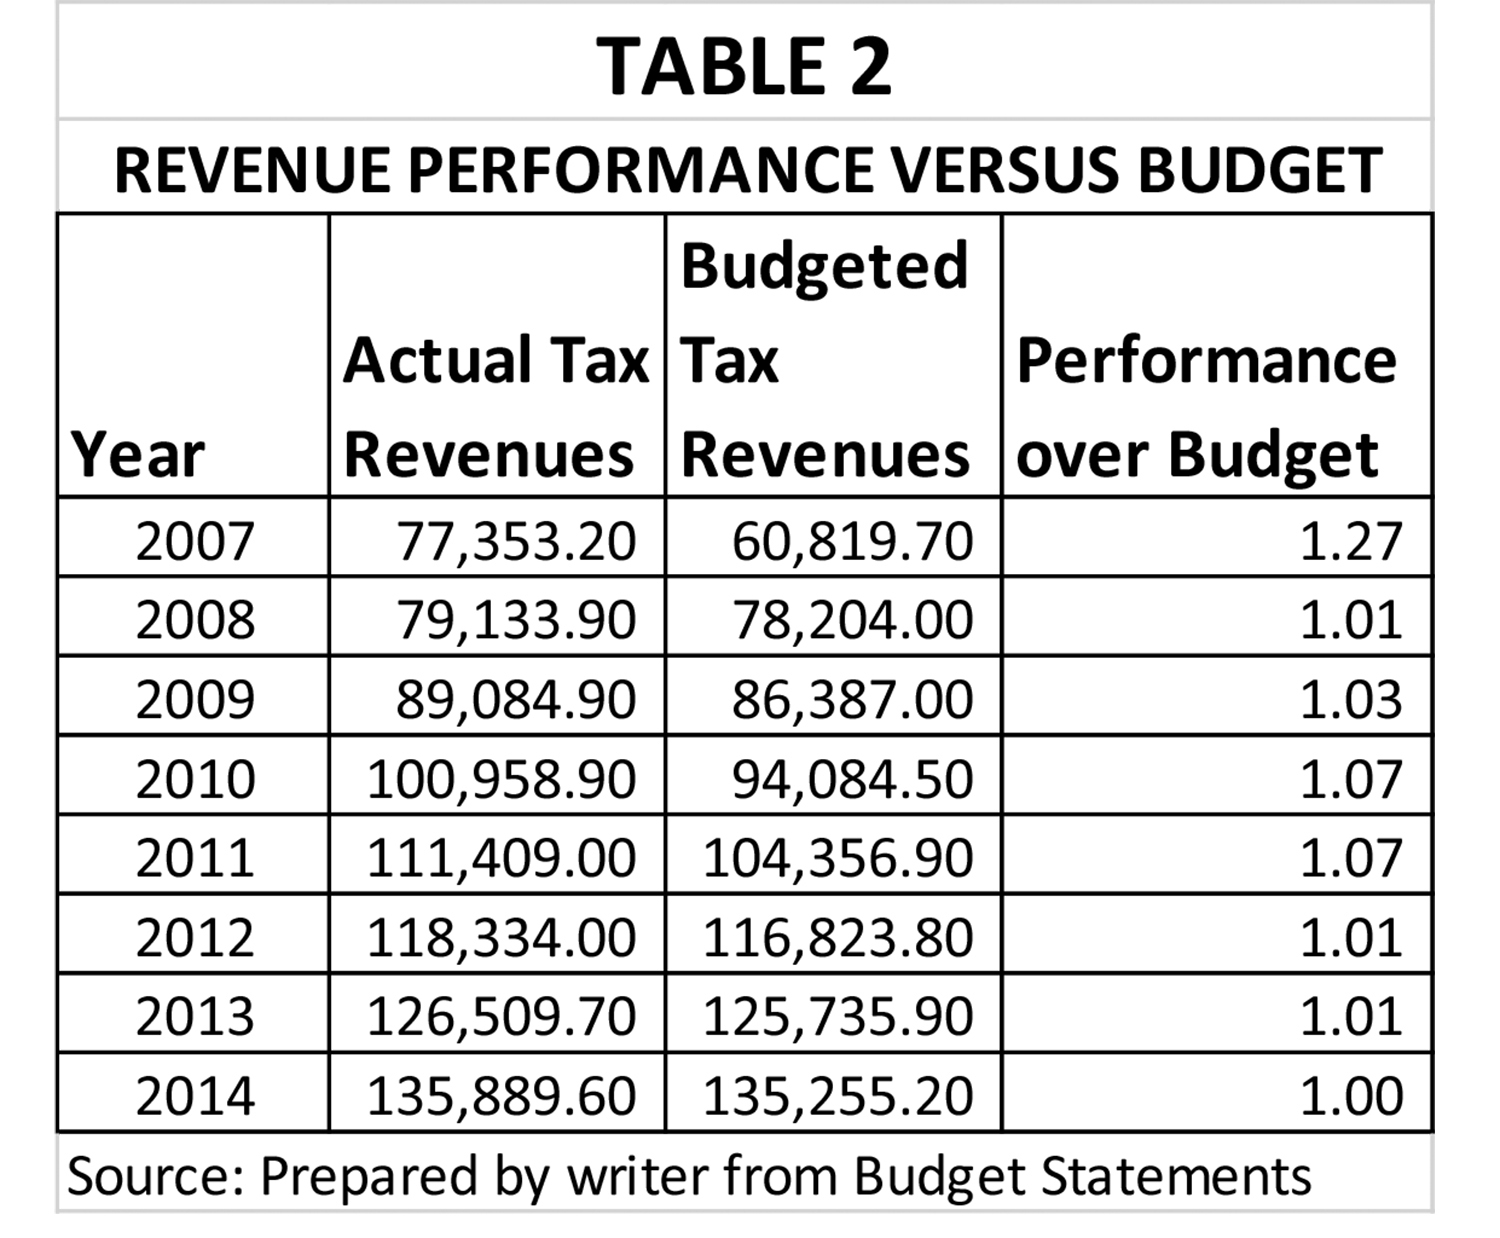
The revenue collection appears good especially when compared to the budget or the financial target that GRA was asked to achieve. Table 2 above reveals that the Authority was able to surpass the budget targets each year with the exception of 2014 when for all intents and purposes, it broke even. Unlike revenue growth which saw its best years in 2009 and 2010, the performance against budget saw its best years in 2010 and 2011. Having peaked at those times, the performance against budget has declined.
The performance begins also to direct attention to the revenue challenge and raises issues surrounding whether or not the government is collecting the optimal amount of taxes. The third Table below reveals the estimated resource gap which the country experienced from 2006 to 2014. The amount has grown phenomenally over the years peaking at G$422 billion in 2013.
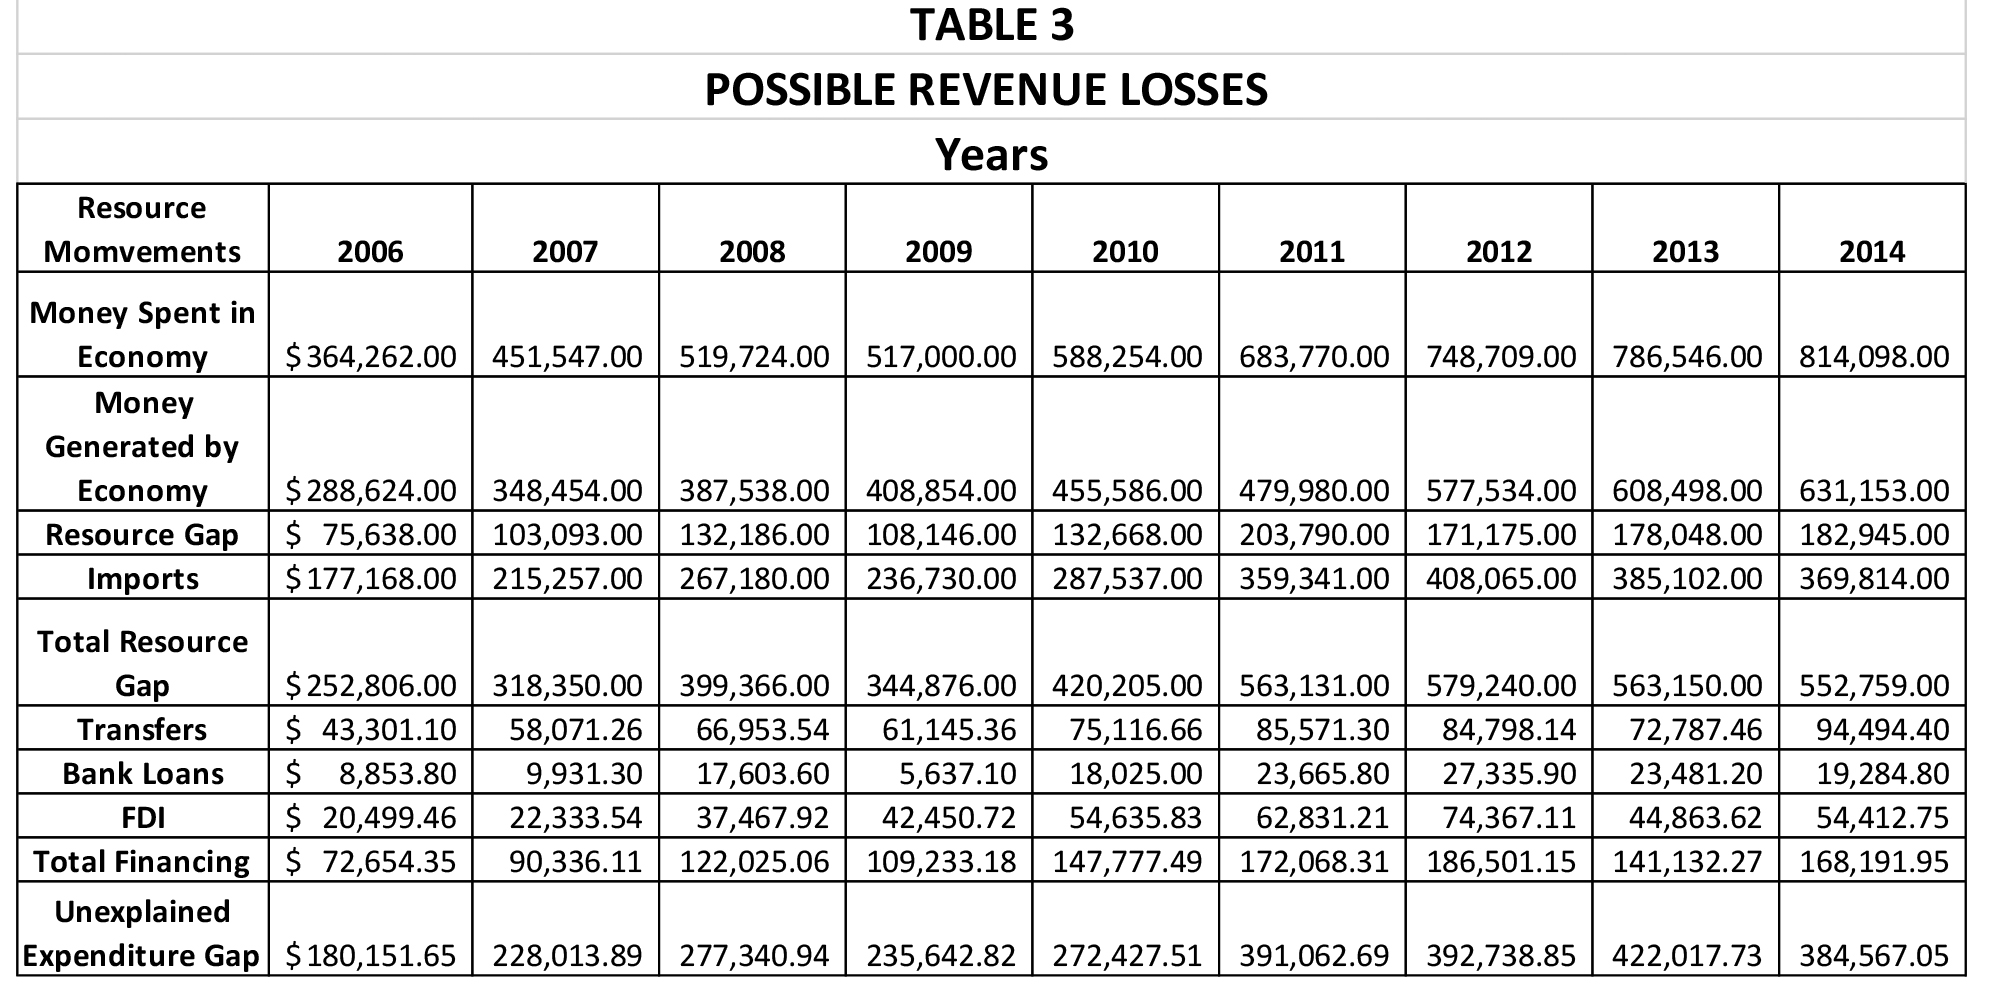
From 2012 to 2014, the unexplained income averaged G$400 billion. In other words, the tax structure particularly as it related to the application of the income tax would have missed a large sume of money just over those three years. It is spending that cannot be explained. The State Asset Recovery Unit (SARU) has estimated that G$90 billion or about 23 percent of the amount is lost to capital flight, money which GRA might have failed to prevent from leaving the country. Other factors impact also optimal revenue collection. (To be continued)
LUCAS STOCK INDEX
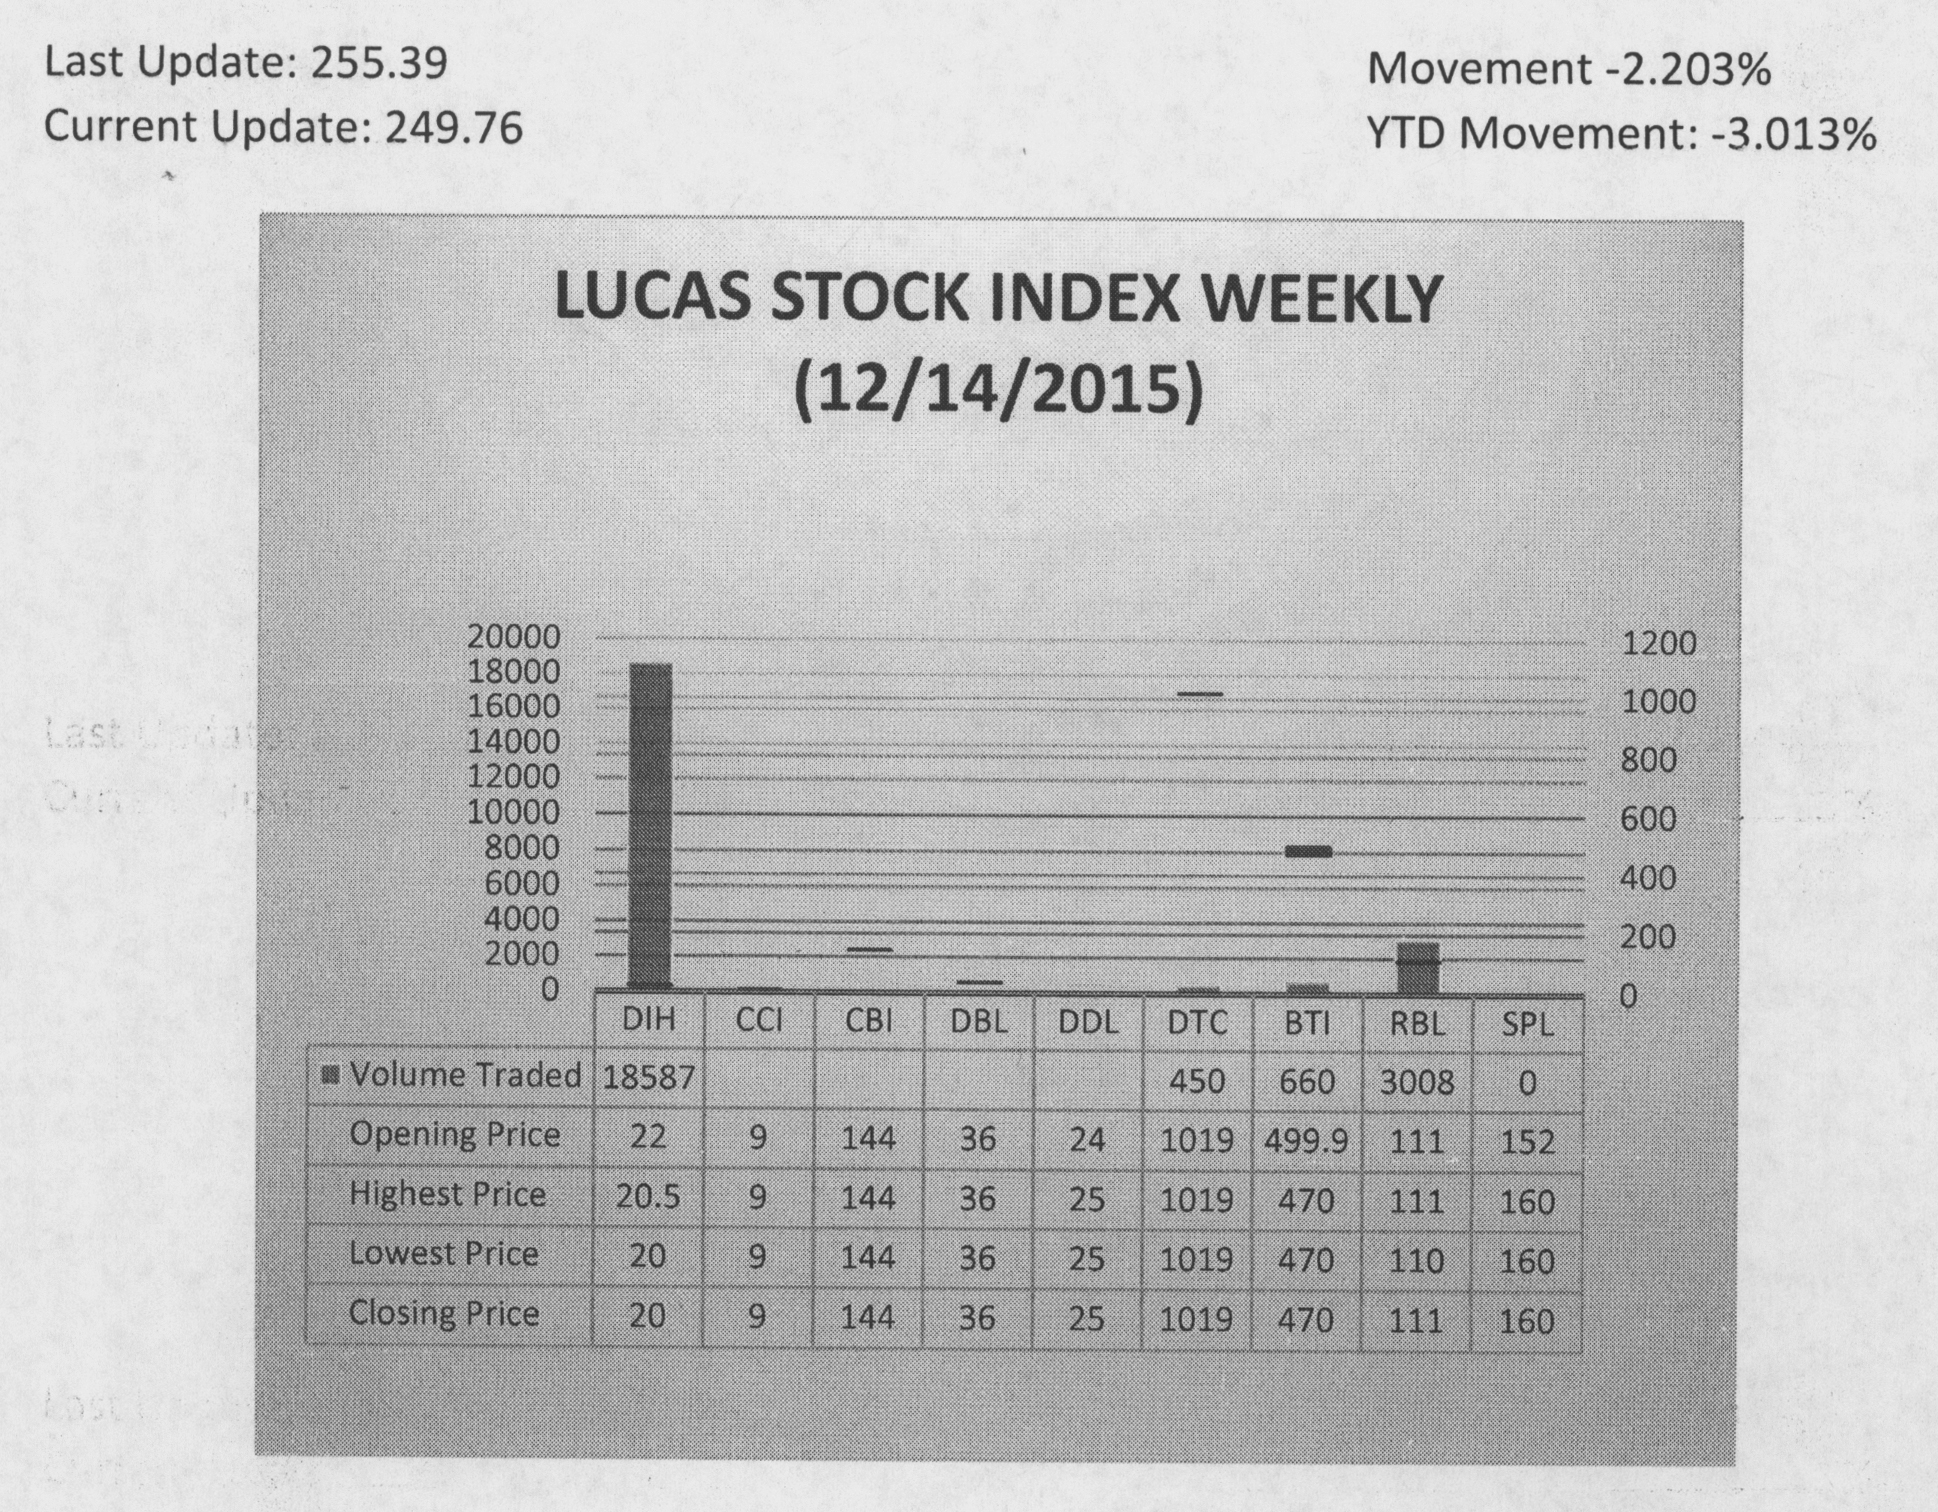
The Lucas Stock Index (LSI) fell 2.20 percent during the second trading period of December 2015. The stocks of four companies were traded with 22,705 shares changing hands. There were no Climbers but there were two Tumblers. The stocks of Banks DIH (DIH) fell 9.09 percent on the sale of 18,587 shares. The stocks of Guyana Bank for Trade and Industry (BTI) fell 5.98 on the sale of 660 shares. In the meanwhile, the stocks of Demerara Tobacco Company (DTC) and Republic Bank Limited (RBL) remained unchanged on the sale of 450 and 3,008 shares respectively.