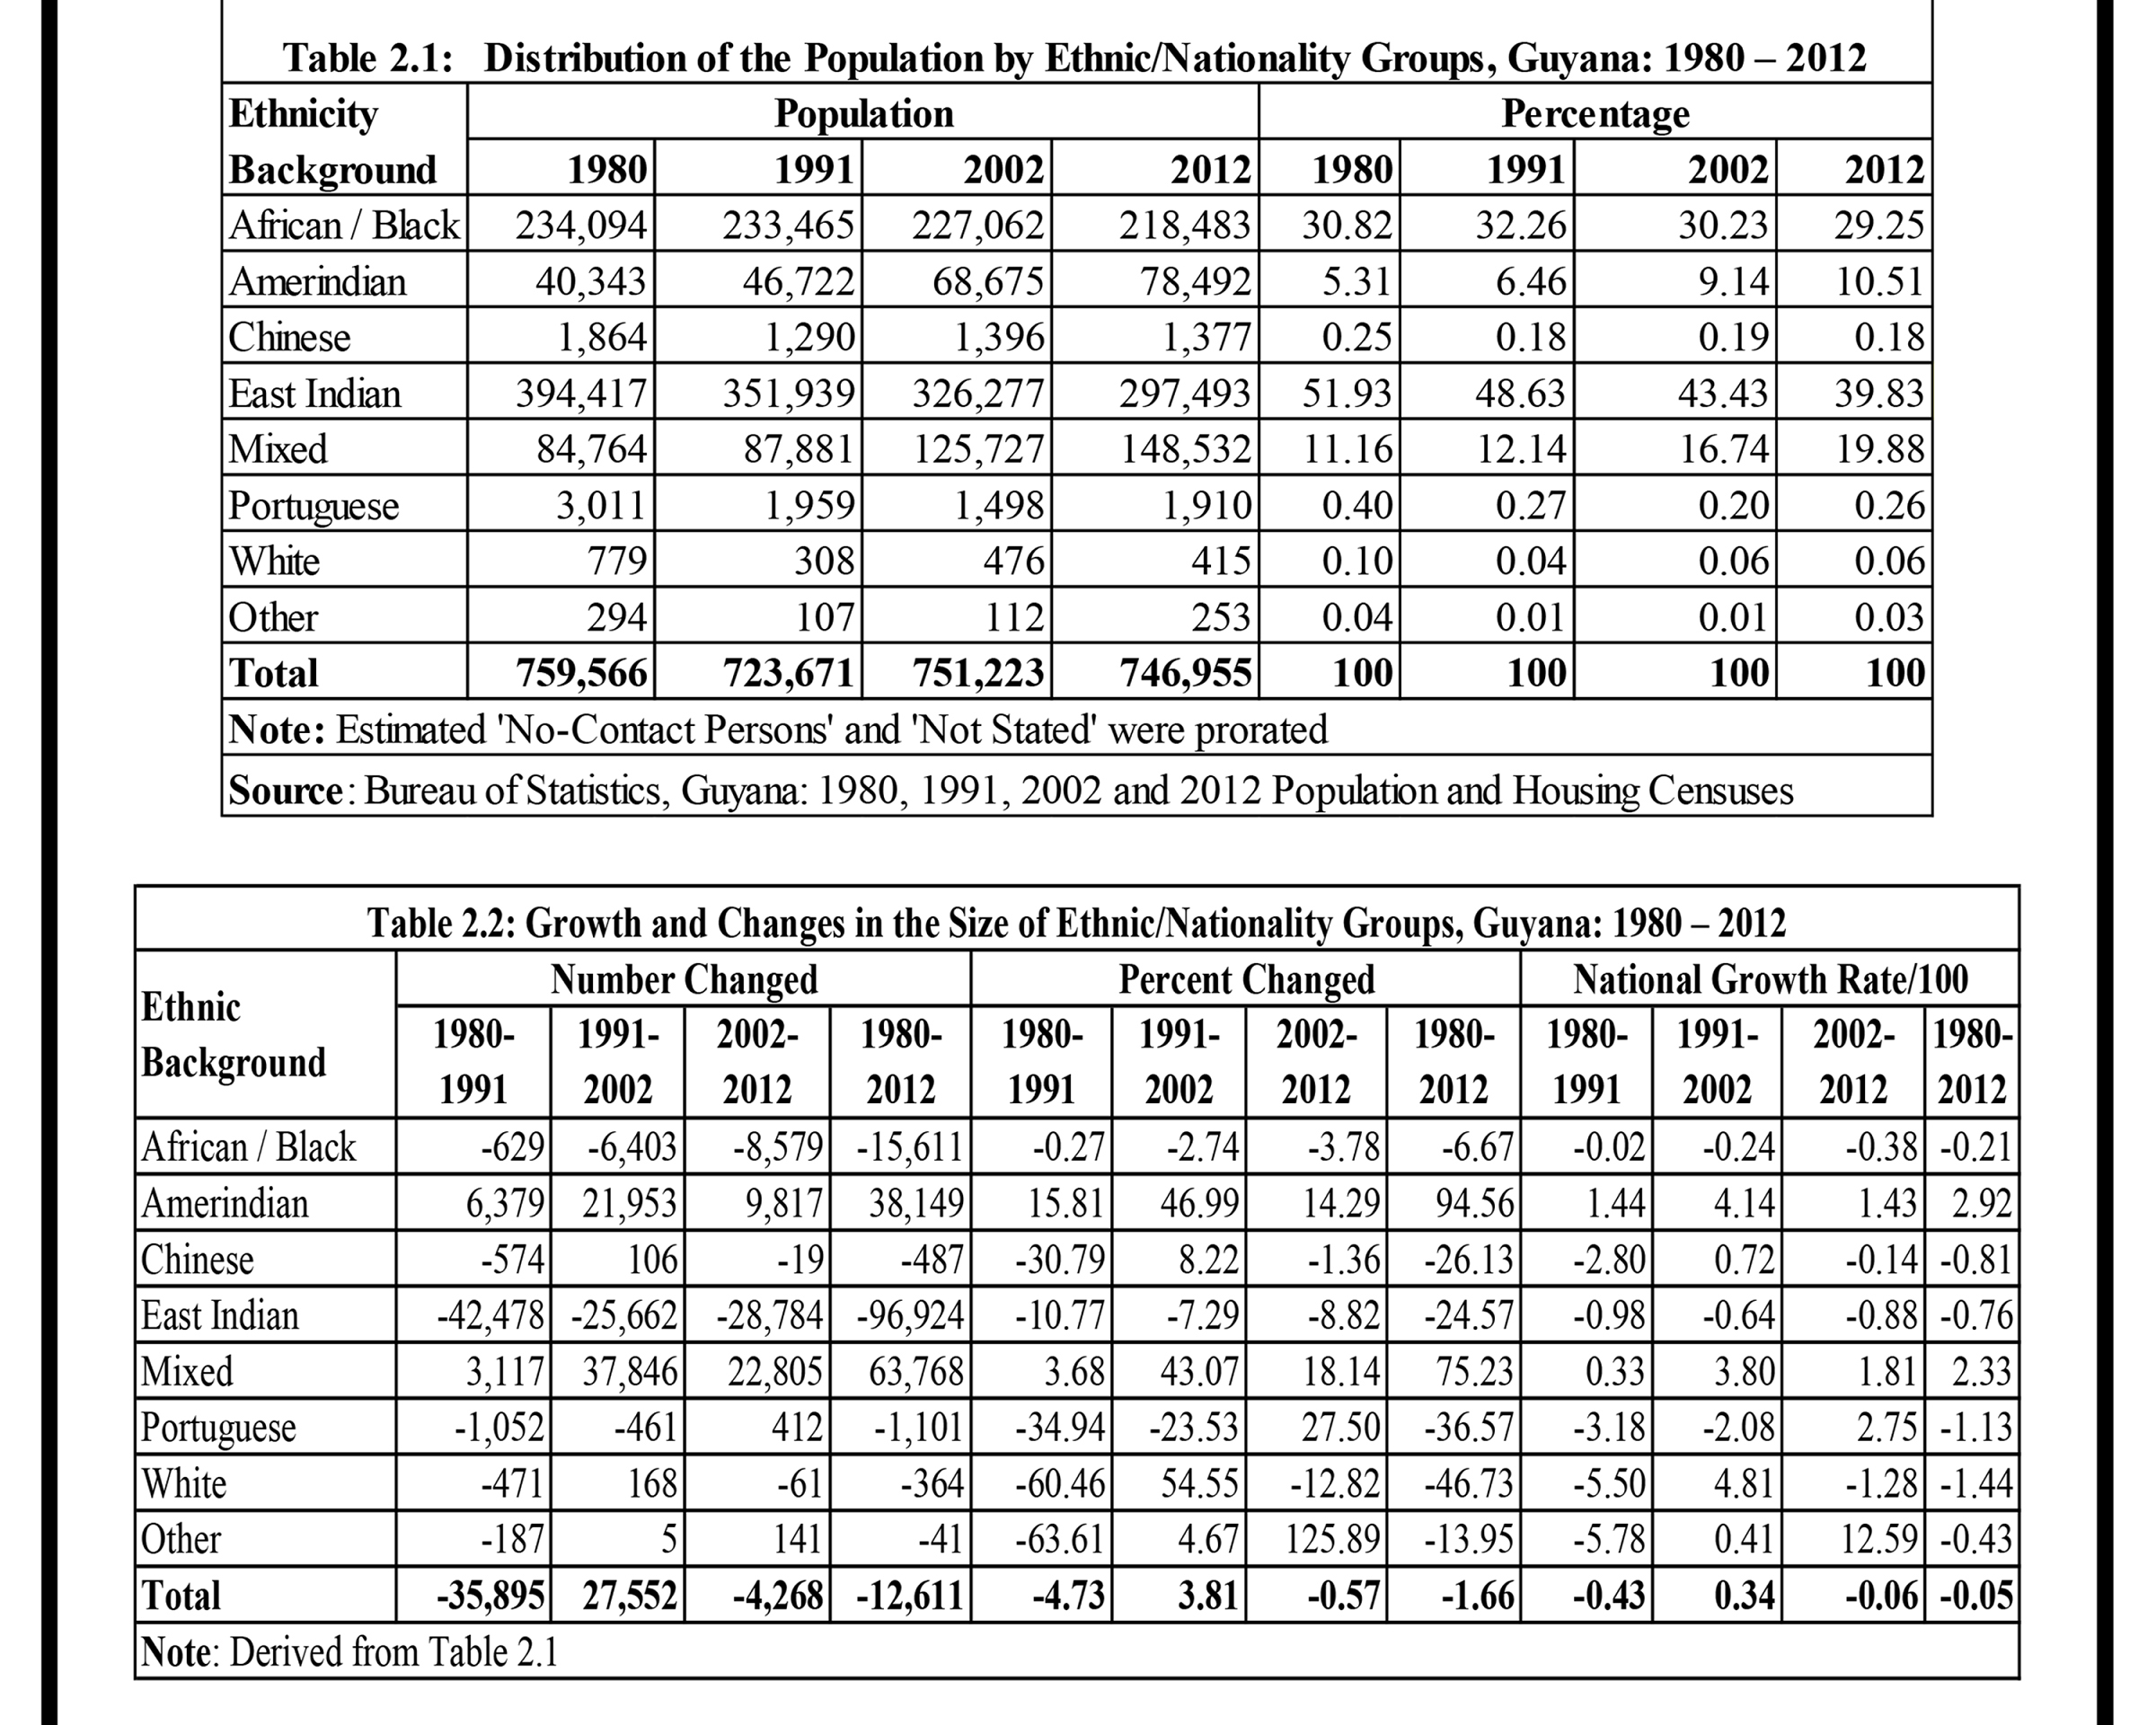
Although the country’s two largest ethnic groups, East Indian and African-Guyanese, continued to decline in their numbers between 2002 and 2012, the drop was offset by continued growth in the mixed race and Amerindian populations, according to the last census.
However, the 2012 National Population and Housing Census also found that despite the shifts, which include the decline in the East Indian-Guyanese population from 326,277 or 43.4% to 297,493 or 39.8%—a drop of 28,784 or 3.6%—the overall ethnic distribution pattern remained unchanged from the 1980s.
The Bureau of Statistics yesterday announced the release of two Compendiums that further detail the findings of the four-year-old census, including the ethnic composition of the population.
In 2014, the Bureau had released preliminary results that showed a drop of Guyana’s population from 751,223 in 2002 to 746,955 in 2012, which Chief Statistician and Census Officer Lennox Benjamin suggested was mainly influenced by migration.
According to Compendium Two, which details the composition of the population, the East Indian-Guyanese group is still the largest ethnic group in the country. The second largest ethnic group remained African-Guyanese, which accounted for 218,483 persons or 29.2% of the total population in 2012. This figure reflected a drop by 8,579 from 227,062 in 2002, when the group comprised 30.2% of the total population.
While there was a combined decline of 37,363 among the Indian and African-Guyanese populations, there was a combined increase of 32,622 among the mixed race and Amerindian populations. The only other group which saw an increase was the Portuguese.
The third largest ethnic group in 2012 comprised citizens of mixed heritage, who accounted for 148,532 or 19.9% of the total population, which represents an increase of 22,805 or 3.2% over the figure in 2002, which stood at 125,727.
“This group continued to be a significantly growing group over the past three decades,” the analysis noted, while pointing out the similar trend among the Amerindian population, which comprised 10.5% of the total population.
According to the findings, the number of persons identifying as Amerindians stood at 78,492 in 2012, which was an increase of 9,817 over the 2002 figure of 68,675.
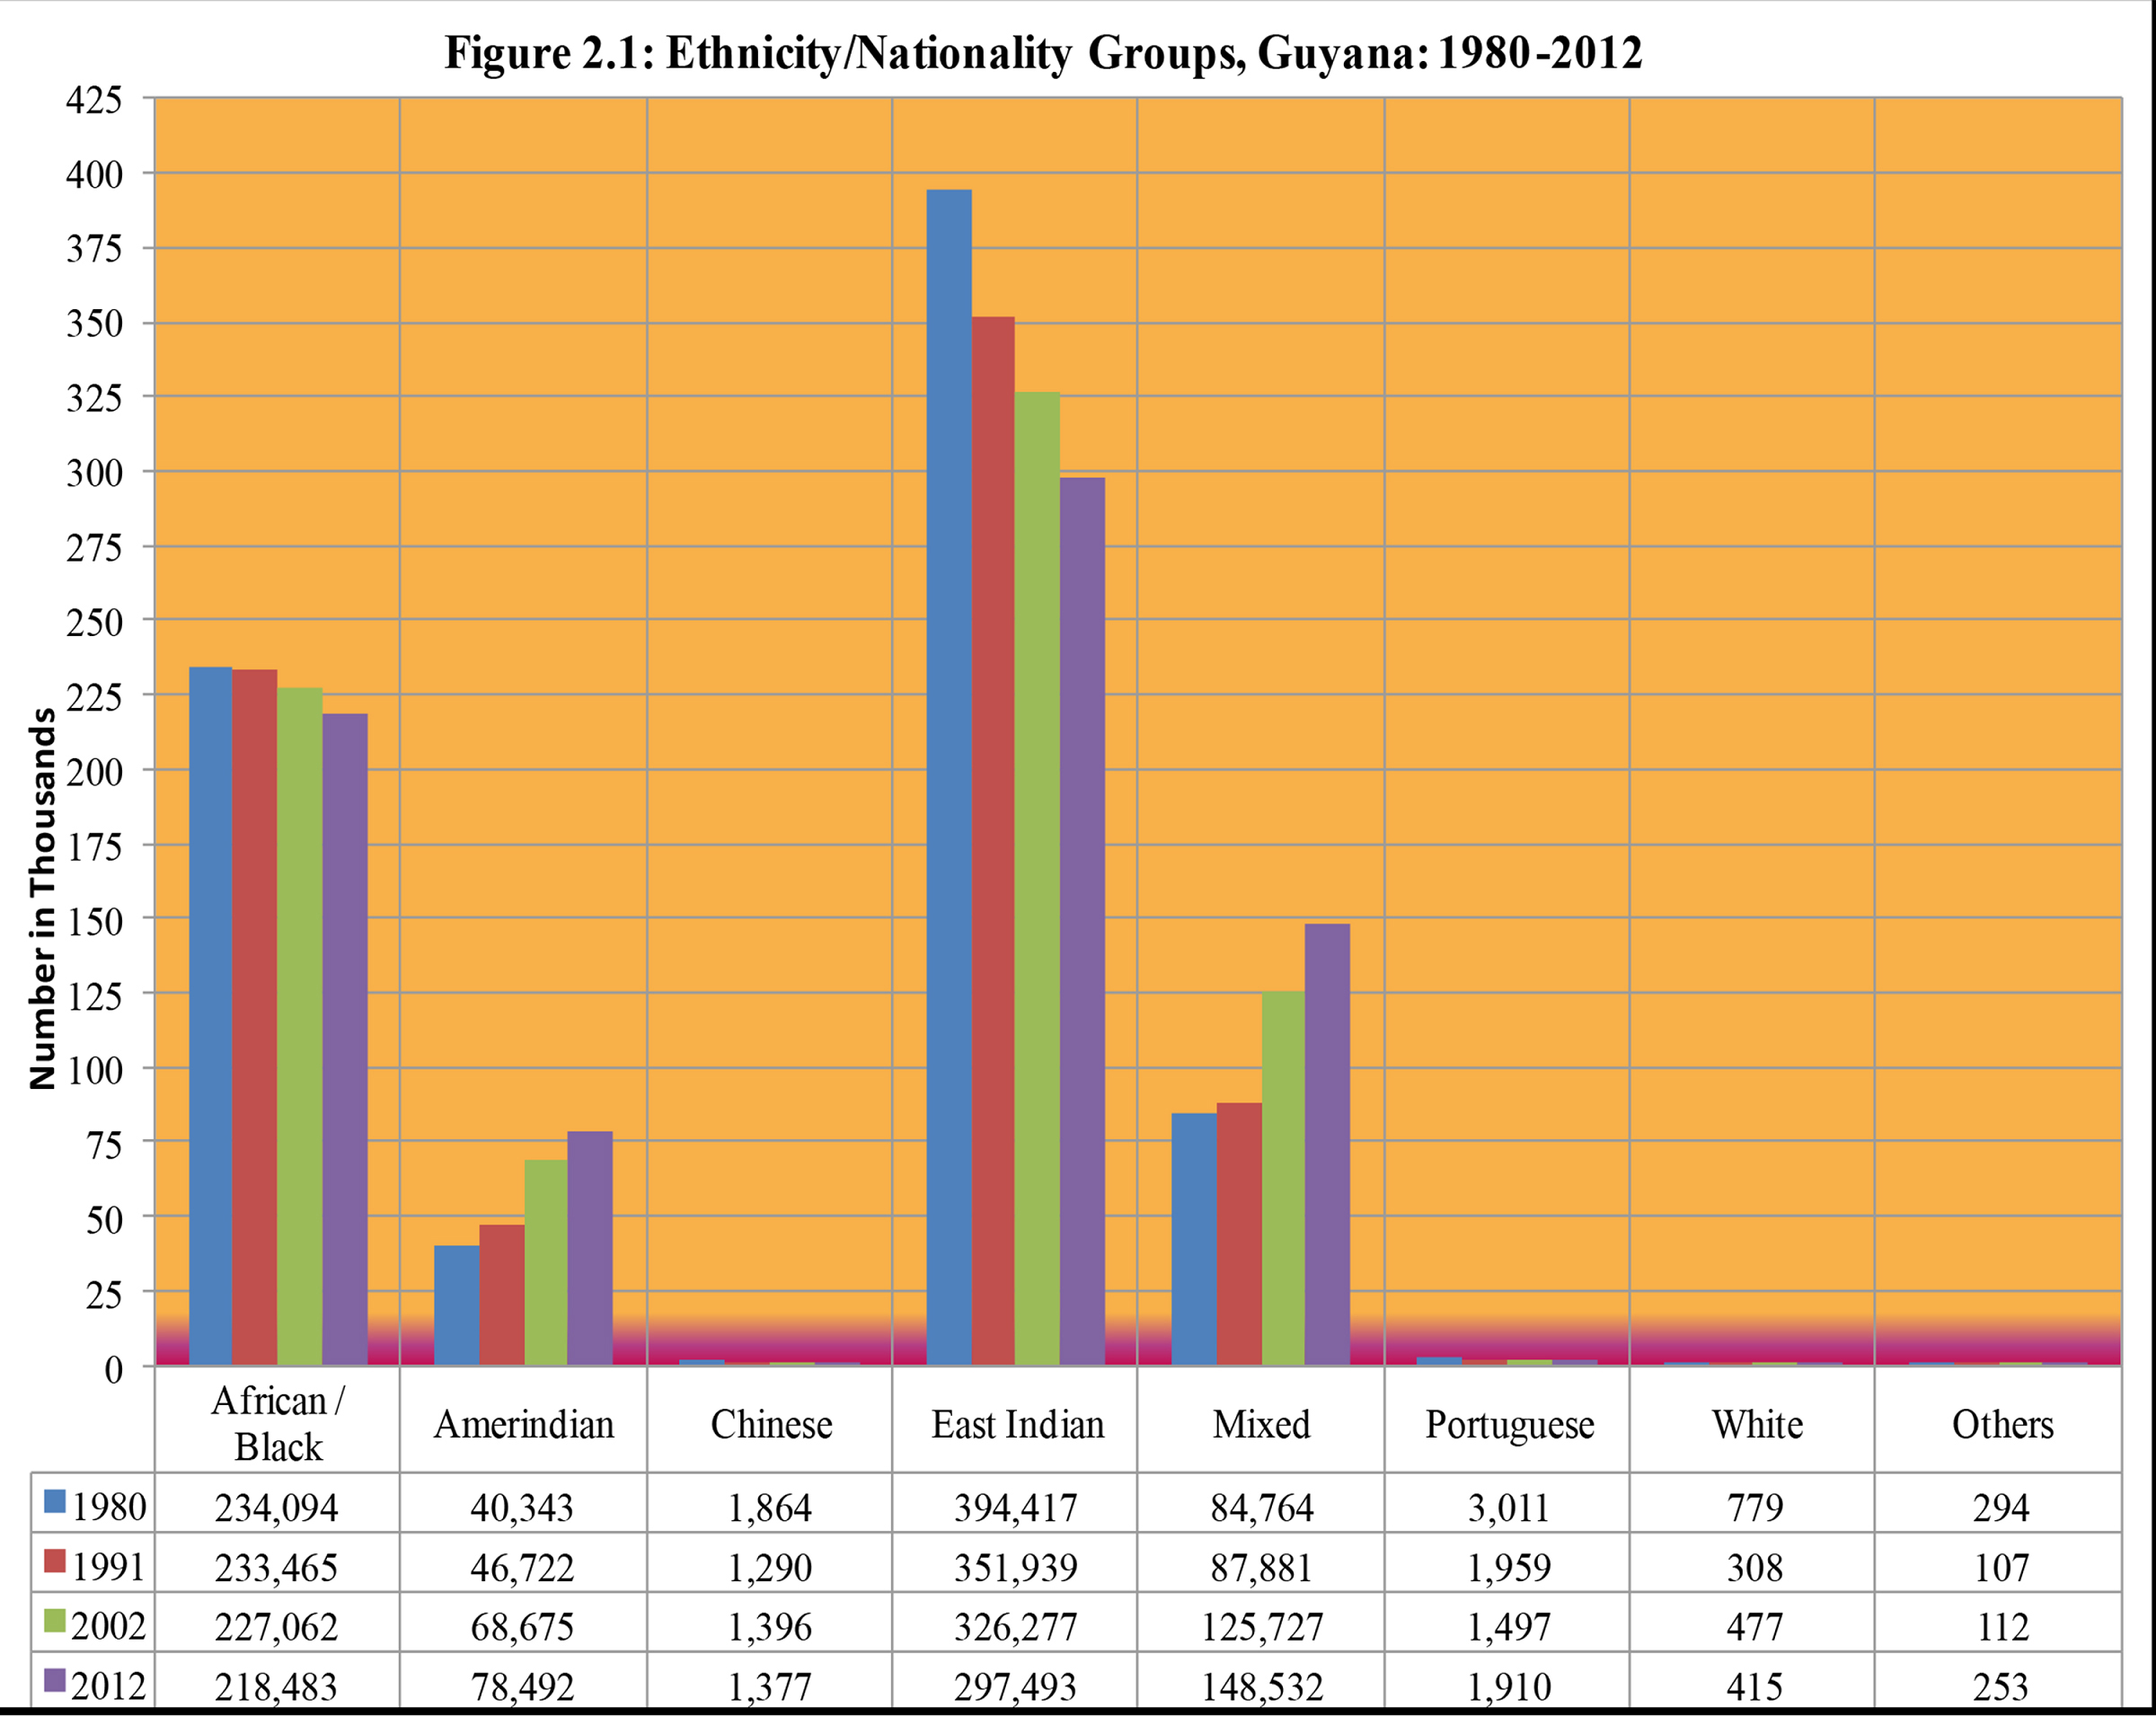 “The numbers of each of these two groups have nearly doubled since 1980 and have almost offset the absolute decline noted for the same period in the two major ethnic groups. With the reduction in the size of the entire population, the relative shares of the ethnic groups have expectedly changed with the two groups (Mixed and Amerindians) which have been consistently growing now accounting for a greater share of the population at the expense of the two traditional dominant groups, namely: the East Indian and African groups,” the analysis pointed out. It was noted too that both the mixed race and Amerindian groups also accounted for the highest percentage of growth since 1980.
It was also pointed out that there has been a positive net inflow of persons from abroad into Hinter-land regions and a net outflow of persons from Coastland regions—where the major groups reside in large—to overseas.
The remaining ethnic groups comprised the Portuguese, which accounted for 1,910 persons (up from 1,498 in 2002) or 0.26% of the total population; the Chinese, which accounted for 1,377 persons (down from 1,396 in 2002) or 0.18%; and those designated as White, which accounted for 415 persons (down from 477 in 2002) or 0.06%.
In addition, it was noted that a small group, made up of 253 persons or 0.03% of the total population, did not identify with any of the listed race/ethnic groups.
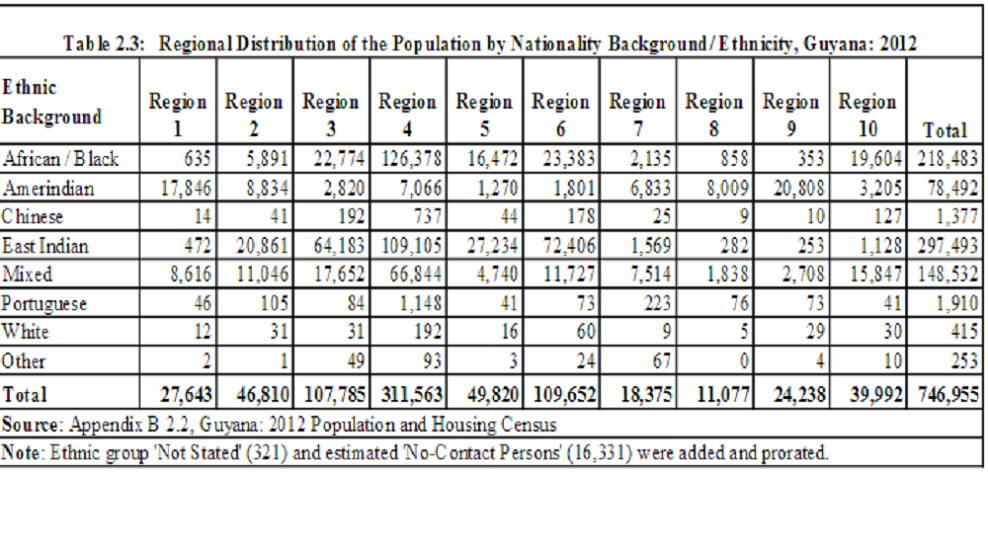
The analysis also includes geographical distributions of the ethnic groups by region and suggests that to the extent that race/ethnicity have social and economic relationships, they could be tied to further analysis of economic activities in the regions, training and levels of education within the groups. “Such findings will be helpful in the design of national and regional plans for human resource development,” it says, while adding that further research could also advance the development of strategies “for the reduction of poverty” and the “amelioration of certain morbidity conditions and their effects,” particularly HIV and AIDS.
The analysis noted that East Indian-Guyanese made up 66% of the total resident population in Region 6; 59.5% in Region 3; 54.7% in Region 5; and 44.6% in Region 2, with fewer numbers in the other regions.
Likewise, it said, African-Guyanese comprised nearly one-half of the total population in Region 10 at 49%; 40.6% of Region 4; 33.1% of Region 5; and lesser proportions in the other regions.
Persons of mixed race, it was noted, had the highest proportion of the population residing in Region 7 at 40.9%; and the second highest proportions in Region 1 (31.2%), Region 2 (23.6%), Region 8 (16.6%), Region 9 (11.2%) and Region 10 (39.6%).
Additionally, the findings show that Amerindians make up 85.8% of the resident population in Region 9; 72.3% of the population Region 8; 64.6% of Region 1; and 37.2% in Region 7.
Meanwhile, a statement issued yesterday by the Bureau of Statistics said the Final Report for the 2012 Census will be disseminated in four main Compendiums. It said the upcoming Compendium Three analyses the important Economic Activity profile of the population and will be disseminated by the end of August. The final Compendium, which will address the remaining key topics such as Education, Fertility, Mortality, and Housing, is to be disseminated by the end November.
It added that a media brief will be held shortly to highlight the main findings so far.
Compendiums One and Two can currently be downloaded from the Bureau’s website: http://www.statisticsguyana.gov.gy/.