
Introduction
As I have opined before, the microeconomic information supplied in last Sunday’s column, depicting employment levels within the extractive forest sub-sector, generally conforms to what might have been anticipated, given the weak, erratic, and declining economic returns exhibited by the sub-sector, when analyzed from a macroeconomic/national accounts perspective, for the decade 2006-2015. As promised last week, today’s column continues with an assessment of other microeconomic data on the sector, focusing on production data. To remind readers, these data have been obtained solely from official sources, mainly the Guyana Forestry Commission (GFC), the Bank of Guyana (BoG) and the Bureau of Statistics (BoS).
Timber products output
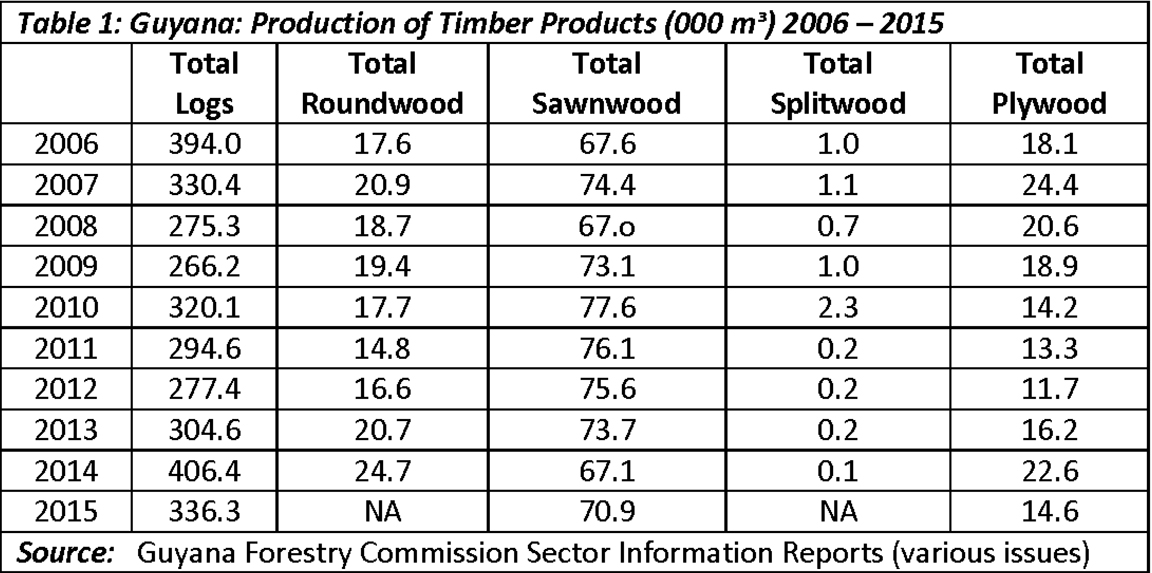
Production data (in 000m3) covering the decade 2006-2015 for Guyana’s five principal timber products are presented in Table 1. These show significant annual variations. Logs constitute the leading timber product; ranging from a high of 406.4 (000m3) in 2014 to a low of 266.2 (000m3) for 2009. When the decade is divided into two five-year intervals, the first (2006-2010) reveals the average output of logs is about 317 (000m3) and for the second (2011-2015) it is slightly greater, (324 000m3). Similar patterns are discerned for the other timber products cited (roundwood, sawnwood, splitwood and plywood). Of note, the weight of logs in national output is dominant.
Non-timber products
Non-timber forest products contribute marginally to total forest sector production. Because this is best documented in the export data, it will be addressed more fully later. However, the reported output of this sub-sector, (which is primarily comprised of wattles and manicole palm) is given in (000 pieces) and not (000 cubic meters). And, for the most recent three-year period, (2012-2014), the output is indicated in Table 2. This reveals both weak output and significant fluctuations even over this limited three-year period!
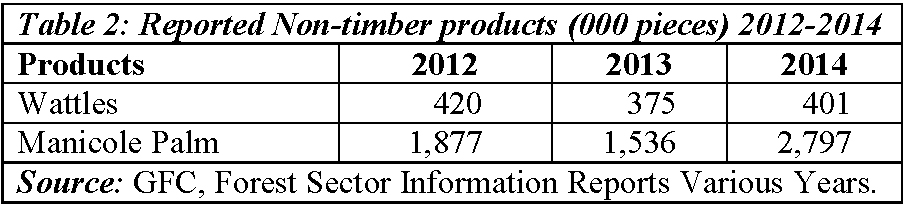
It can be reasonably inferred that the weak state of non-timber forest output reveals not only how consolidated the extractive forest production favours timber products, but also the bias in favour of log production. And, while the contribution of logs to total output has varied annually, typically this has averaged more often than not, about two-thirds of total forest production.
Domestic prices
Most of Guyana’s forest sector output is sold in overseas markets. As a consequence, an assessment of the export behaviour of timber and non-timber products over the past decade remains crucial. That topic will be addressed next, but before I turn to it, let me introduce in this section data on the recent price behaviour for domestic timber sales (2010-2015).
Table 3 provides domestic prices for selected timber products, expressed in US$ equivalent, at prevailing exchange rates. These data reveal that, in most instances, there has been a strong improvement in prices during the past six years (2010-2015). Thus, the price of logs has increased 2.34 times over this period. The price of sawnwood (combined average for dressed and undressed sawnwood) has increased 2.40 times. The price of roundwood has increased (1.96 times). The price of splitwood has increased 1.2 times. And, finally the price of fuelwood has increased 1.4 times.
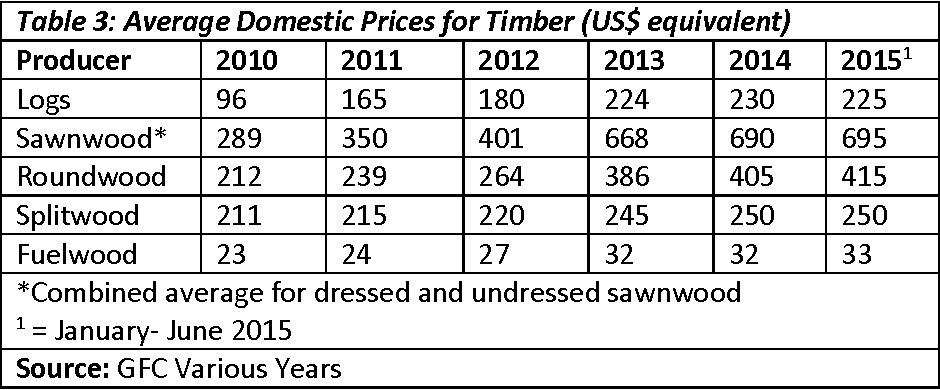
By using the United States dollar exchange rate equivalent as the numeraire, this helps to dampen the effect of purely domestic inflation on domestic prices. This therefore, makes these prices a ‘truer’ indicator of the trend. The data suggest that overall, the effect of this strong price performance has compensated for weak performances in the volume indicators. It should be noted as well that strong price movements in the export market have contributed towards pushing domestic prices up.
Conclusion
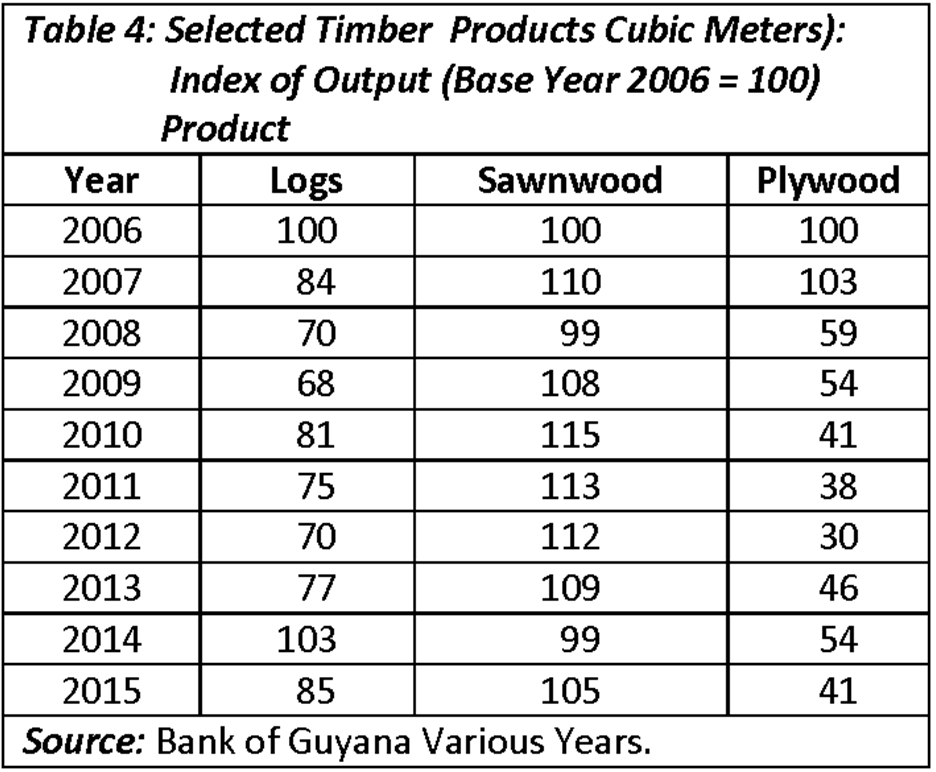
Finally, in an effort to amplify the information given above, Table 4 shows the index of output for three timber products, logs, sawnwood (average for dressed and undressed) as well as plywood, for the decade 2006-2015; 2006 is the base year (100).
The table reveals logging has been below the base year total of 100 for nine of the ten years. Sawnwood has shown on average about a seven per cent increase during the second half of the decade. And plywood has declined precipitously from 100 in 2006 to a low of 41 in 2015.
Next week I shall move on to wrap-up this examination of the microeconomic assessment of the extractive forest sub-sector.