Introduction
 Today’s column addresses the “cost-price relation”, likely to emerge as Guyana transforms its oil and gas “discovery” into an industrial success. To remind readers, this is the third of four features of Guyana’s “discovery” singled out for further amplification. The present column starts with cost and continues with price next week.
Clearly, at this early stage of my presentation, this can only be an indicative exercise. Exploration of the “discovery” is ongoing, and attempts to determine cost before production commences are definitely speculative. Consider also, present best estimates expect production and export to take place 5-7 years from now. Indeed, the “consortium” of multinational companies, exploring and developing the Guyana play, seems to be only at the early phase of appraisal, mobilization, feasibility and project financing.
Highlighting this feature now, underscores the fact that the wider is the positive difference emerging between the overall unit cost of producing oil and gas and the market price for these products, the greater is the benefit for potential beneficiaries. As previously indicated, while these beneficiaries certainly include Guyana, they are, by no means, exclusive to Guyana. Shareholders, investors, and other stakeholders within the “consortium” enjoy legitimate expectations for benefits; given the financial and other risks they have undertaken, and their up-front resources provided for the exploration of the “play”.
Nonetheless, the eventual distribution of benefits between various groups of claimants, will be largely shaped by arrangements between the Government of Guyana (the resource owner) and the Consortium (the developer). Most of Guyana’s benefits will be reflected in its levels of consumption, income, wealth, employment, production, linkages, growth, and development during the production phase.
The Indicative Relation
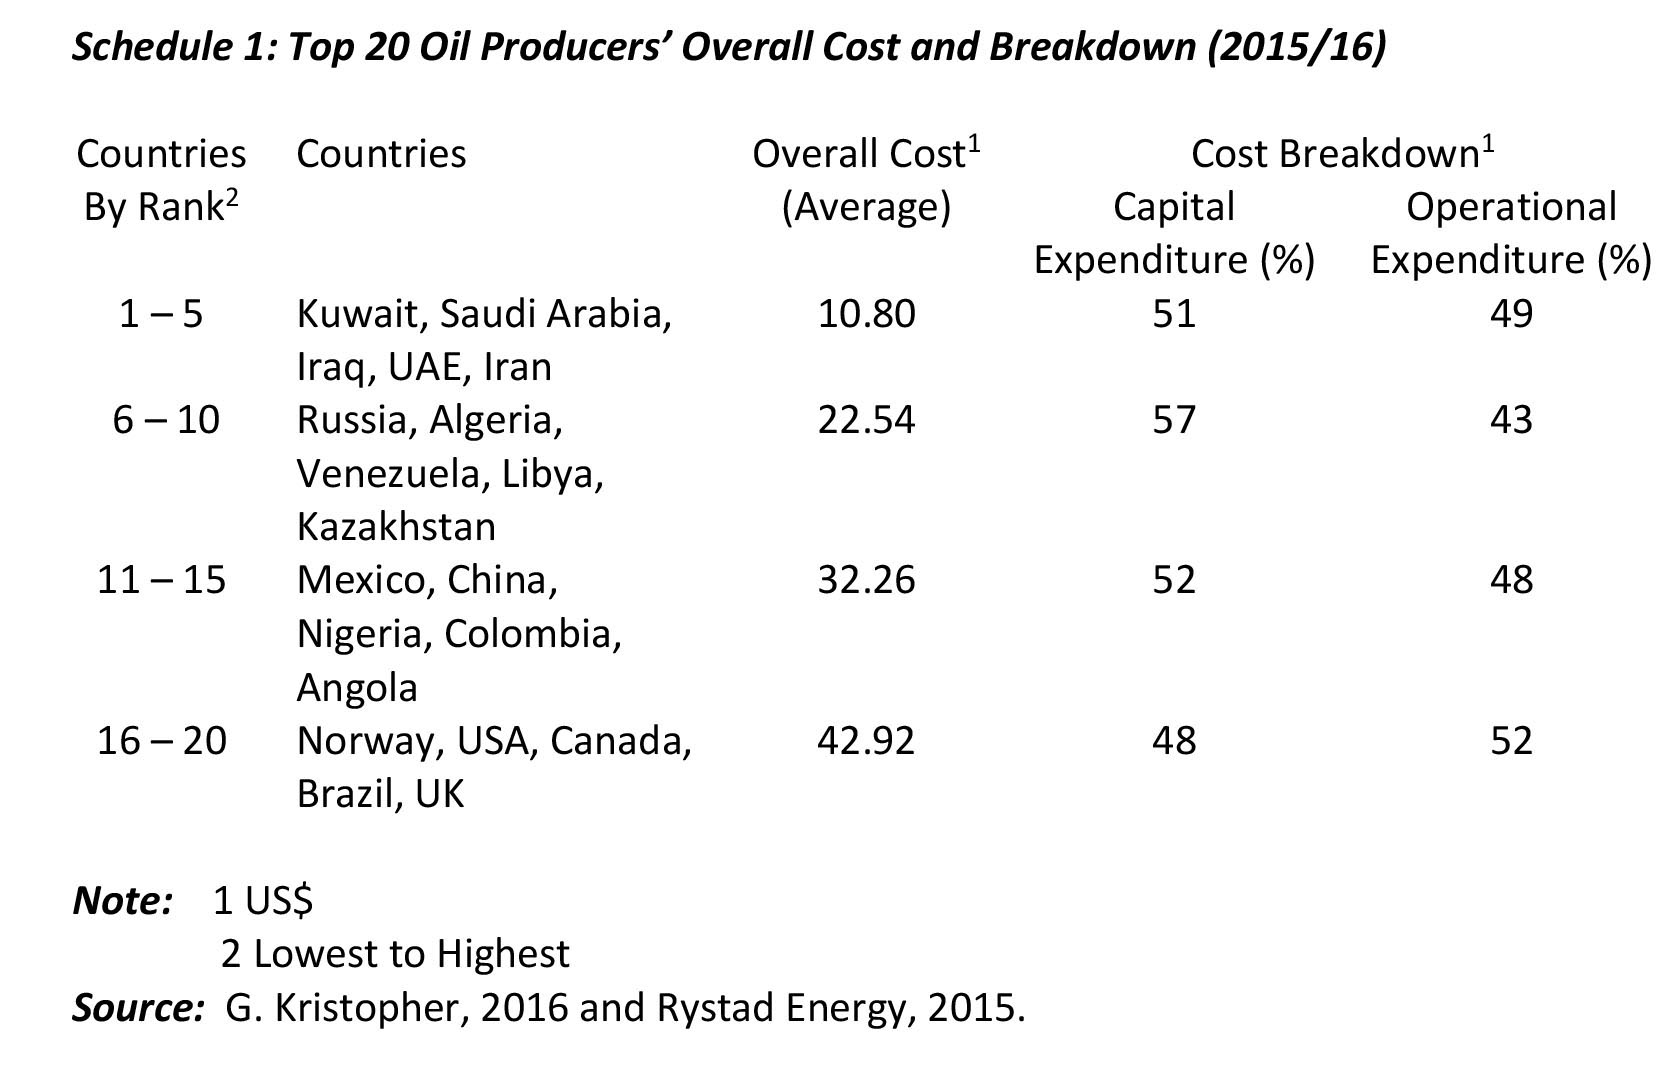
To give readers an idea of the magnitudes likely to be involved in the cost-price relation, Schedule 1 shows estimates of the overall average unit cost of production for the top 20 oil producing nations. The data for these 20 countries are derived from operations in over 15,000 separate oil fields. These costs comprise 1) capital expenditures, including the costs of building oil facilities, pipelines, wells and so on 2) operational expenditures, including the costs of getting “the oil out-of-the-ground”, payrolls and general administrative services.
Schedule 1 organizes the data into four groups of five countries each; ranked from the lowest overall unit cost (1-5) to the highest (16-20). The overall unit cost for each group represents a simple average of the reported overall cost for the 5 members of the group. This overall cost is further broken down into the two items identified above; namely, capital expenditures and operational expenditures.
What the data show
What do the data show? First, the overall unit cost for the five highest cost producers group is approximately four times as large as that for the lowest cost producers group. The respective ratios for the five lowest cost producers (group 1-5) to the other three groups are approximately 1:2; 1:3; 1:4. Second, the country with the lowest overall unit cost, Kuwait (@ US$8.50) has a cost less than one-sixth that of the highest, the United Kingdom (@ US$52.51). Third, the range in overall unit costs is high (@ US$44.00).
Fourth, the main descriptive statistics reveal the simple average (mean) of the overall unit cost values for the top 20 nations is US$27.10. And, fifth, the median value is US$28.50. Sixth, variation in the overall unit costs from the simple average (variance) is quite strong. The mean absolute deviation is 10.50 and the coefficient of variation in the values is 0.474 (and therefore the relative standard deviation is 47.4 percent).
Seventh, the average percentage distribution between capital expenditure and operational expenditure for all four groups of countries is 52:48. The data do not indicate a unique relationship between the size of national production and this ratio, except perhaps that the ratio is the worst (48:52) for the highest cost producers! However, the ratio does not consistently worsen across all four groups of countries, as their average size of production increases.
Other Observations
Examining references by industry analysts’ to Guyana’s “discovery”, I have observed that two of the top 20 nations are occasionally referenced as comparators, namely, Angola and Venezuela’s offshore deposits. Stretching the inference from this, and based on the data used to compile Schedule 1, the respective overall unit costs of these two are US$35.40 and US$23.60.
Similarly, these analysts speculate that significant cost challenges face the Guyana project, including 1) logistical, based on the isolated location of the “discovery” and the absence of suitable already installed infrastructure 2) health and safety of the workforce, given its offshore location 3) environmental, due to risks of oil spills and other accidents and 4) process management of the oil and gas fields. Guyana should therefore be happy if its cost of production approximates either of these two!
Conclusion
As indicated before, offshore oil and gas production utilizes facilities and techniques that tend, on balance, to raise unit costs. Expensive drilling platforms and submersibles are used to explore deep-water environments. These are costly, and so are the production platforms required to get the oil “out-of-the ground”, and to market. Such operations require highly specialized workers and entail difficult process management. These raise costs.
Clearly, from the above there can be no firm basis for observers to determine, with enough certainty, production costs for the Guyana “discovery”. The indicative details presented above are the best that can be sensibly offered at this preliminary stage.