 Introduction: Cost-Price Relation
Two weeks ago (October 23), this column had introduced as part of the continuing discussion of “Guyana in the coming time of oil and gas production and export”, the notion of the “cost-price relation” that could emerge after production starts. The reason for considering this, is that the greater is the positive difference between the unit total cost of production and distribution, and the price received for a unit of sale, the greater is the likelihood of gross profit (surplus) flowing to the producing firms. And, further, the greater also is the likelihood of the industry operating as a sustained and successful commercial venture.
It was argued then however that, at this early stage (with production about 5-7 years into the future), it would not be possible to fix the cost of production with an acceptable degree of accuracy. As a consequence, I resorted to introducing what I have termed an “indicative cost”. To be frank, this cost is little better than an informed guess! It has been derived from 1) an examination of cost data for the Top 20 oil producing firms, in order to obtain a feel of the magnitudes involved and 2) the fact that industry analysts have drawn similarities between the geological configuration of Guyana’s offshore deposits and two of the Top 20 countries; namely, Angola and Venezuela.
Today’s column offers in similar vein, an indicative price for crude oil in 2025. Recall, last week’s column has already considered 1) the structure and organization of the crude oil market 2) the “economic” drivers impacting on price and 3) the “non-economic” drivers. I had pointed out that recent estimates show an incredulous range for the 2025 crude oil price; ranging from as low as under US$30 to over US$230, per barrel!
World Bank Crude Oil Price Estimates
However, perhaps the estimate of future crude oil prices with the best global credentials, is that provided by the World Bank Group in its quarterly publication: Commodity Markets Outlook. Selected data from its latest issue (October 2016) are shown in Schedule 1.
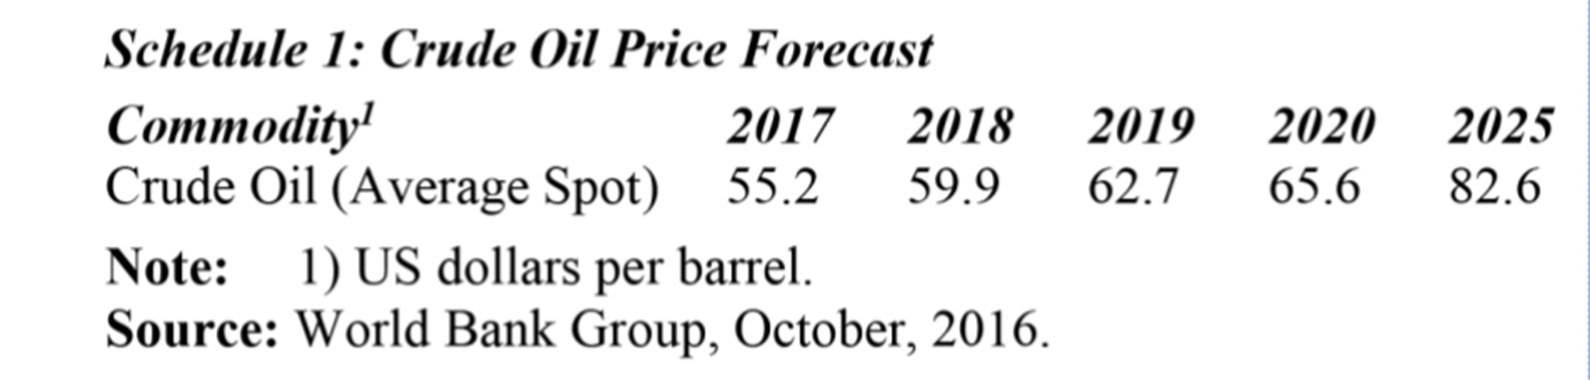
Points to observe in Schedule 1 are; 1) there is a steady upward rise in price to 2025, increasing by 50% above the 2017 level; 2) the prices quoted are nominal, so they do not isolate the effects of inflation; and 3) prices cited are given as the average of the spot price. Generally, over time, these quarterly forecasts tend to vary significantly both in the short run and well out into the future. This underscores the difficulty in reliably forecasting the crude oil price, which traditionally, has been very volatile. This is indeed not surprising, given the formidable list of economic and non-economic factors that, in real time, impact on crude oil prices, as revealed last week.
US Energy Information Administration
By way of comparison to the World Bank estimates, the United States Energy Information Administration (ElA) in 2015, used for its ‘’high oil price scenario”, a crude oil price of US$169 for 2025 at constant 2013 prices! That constant price estimate eliminates the effects ot general inflation. Significantly, this EIA 2025 estimate is comfortably more than twice that estimated by the World Bank. Of note also, the EIA’s “low oil price scenario” projects a price less than one-half that of the “high oil price scenario” (US$64 for 2025).
When assessing the crude oil price so far into the future, one has to make judgments about future risks, given the intrinsic uncertainty of oil market behaviour. Downside risks are likely to depress oil prices. And, such risks are likely to entail the combination of falling demand and increasing supply, and their net effects. Upside effects, of course, relate to the reverse. That is, rising demand and reducing supply.
In my opinion, going forward upside performance would focus heavily on demand growing among emerging and developing economies and lower global supply as a result of energy policies and regulations, or cartel behaviour on the part of OPEC. Similarly, downside performance would center on demand falling in emerging and developing economies combined with investment and expansion in OPEC supply and new discoveries, like Guyana’s.
Indicative Price
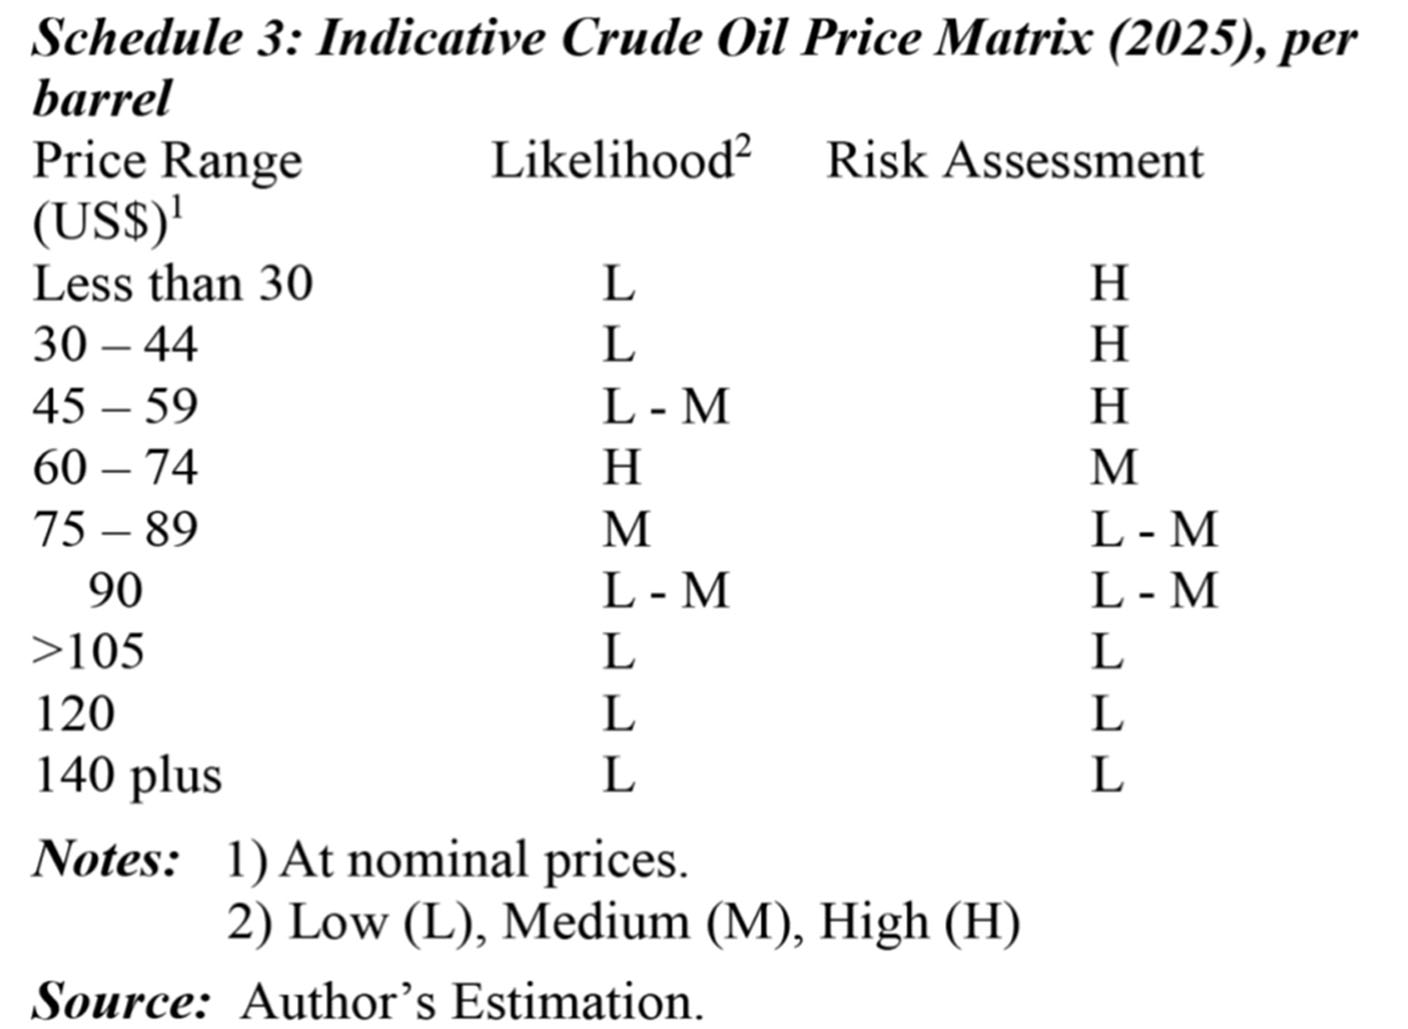
Following on these observations I have constructed a matrix (Schedule 2) indicating the target crude oil price range, which I estimate will prevail in 2025. In the Schedule, price ranges are given in units of US$15. The likelihood of each listed price range is rated on a scale from low to high, as indicated in the Schedule. The Schedule also shows the level of assumed risks facing the commercial viability and sustainability of Guyana’s oil and gas industry for the different price ranges.
Conclusion
My estimate shows, the highest likelihood is that the price will fall between the two ranges, US$60-74 and US$75-89, with the lower range the more likely.
Before completion of this topic I will address a hotly disputed issue in petroleum economics, which is the determination of the break-even price for oil firms. I shall indicate, as I proceed next week, the oil firm’s break-even price is, however, different from the country’s break-even oil price. I shall start considering the issues surrounding this observation in the next column.