 Today’s column concludes the ongoing presentation of background information on the global forest environment. The initial focus of this effort has been on trends pertaining to the first area of my coming discussion on the state of Guyana’s forest, which will be the size and rate of deforestation. The information, which will be provided comes from the FAO, Global Forest Assessment (GFA) 2015. After completing this task, I start the description of the state of Guyana’s forests.
Global trends
Several global trends stand out in the FAO, GFA 2015, and those of importance to this introduction are first, between 1990 and 2015, there was a net decrease of 3 per cent in the global area of forests. This decrease was realized after both natural and human-induced deforestation was taken into account, and then offset for increases in the area of forests arising from natural and human effects.
Second, the average annual rate of net forest loss of 3 per cent during 1990-2015 was halved over this 25 year period. Further, while this decline in the rate over the 25-year period is encouraging, as the FAO observes, this should be tempered by the consideration that the decline has not been due to reduced rates of human-induced deforestation.
Instead, it has been due to increases in the area of planted forests, intended to compensate for human-induced deforestation of the natural forests. Worldwide, planted forests have increased in size, from 167,593 thousand hectares in 1990, to 277,973 thousand hectares in 2015; an increase of 36 per cent.
Third, the GFA 2015 reports 44 per cent of the global forest cover is located in the tropics. Another 8 per cent is located in sub-tropical countries; temperate countries account for 26 per cent; while, boreal countries (including polar) account for 22 per cent of the global forest area. Geographically, Europe (including the Russian Federation) is the largest forested region, with 22 per cent. This is followed by South America (21 per cent), and North America (16 per cent).
Fourth, the distribution of global forests by income levels reveal that three quarters of all forests are located in high and middle income countries. Despite popular belief, just 25 per cent of global forests is located in lower middle or low-income countries.
Fifth, global trends in net forest loss vary by climatic area. The tropics have been the climatic domain with the greatest forest loss.
Indeed, the temperate regions saw increases to their forest cover, while the sub-tropical and boreal domains recorded little change. Significantly, net forest loss in the tropics has been dominated by Brazil in South America, Indonesia in Asia, and Nigeria in Africa. However, the FAO data also reveal the rates of deforestation for 2010-2015 in Indonesia and Brazil are 40 per cent lower than the earlier rates of the 1990s.
To wrap-up this effort at portraying the global forest environment, I offer a brief comment on the quality of the FAO data presented above in the next section.
Data quality
The FAO has observed that the many variations in definitions of what is the forest and also in the methods of its measurement have enormous policy implications. Consequently, it has advised policy makers to evaluate the impact these differences can have on the reported data, if these are used either 1) to monitor deforestation and reforestation rates and/or, 2) to establish targets, such as greenhouse gas emissions and sustainable forest management.
Finally, it should be noted the FAO 2015 has declared “a comprehensive monitoring approach that integrates remotely-sensed data of sufficiently high resolution with field measurements and observations” is needed for accurate measurement of forests.
With this comment I turn next, to introduce in this and coming columns, basic forest data for Guyana, based as I have indicated, primarily, if not exclusively, on FAO data.
Guyana basic data
Published data on the size of Guyana’s forests vary significantly. As addressed in these columns, this is largely due to the different definitions utilized. Therefore, I present some basic data derived from the recent FAO, GFA 2015. In its forest resources assessments, the FAO standardly reports on both “forest” and the related category of “other wooded land”. Similar to the forest, the latter category refers to land greater than 0.5 hectare with trees higher than 5 meters. However, unlike the forest, the canopy cover is between 5 and 10 per cent.
As indicated last week, the forest’s canopy cover is greater than 10 per cent. Similar to the forest though, the “other wooded land” excludes predominantly agricultural areas.
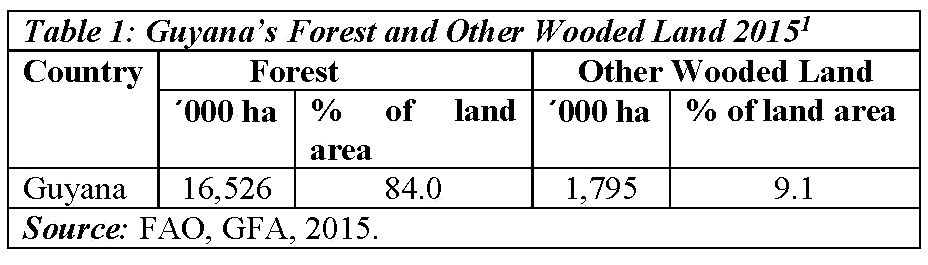
Bearing in mind that the published estimates of Guyana’s forest area vary, the FAO’s estimates, which these columns rely on are presented in Table 1. The total forest area is estimated as 16.5 million hectares, or 84 per cent of Guyana’s land area. “Other wooded land”, accounts for about 1.8 million hectares, or 9.1 per cent. The grand total of forest and other wooded areas is 18.3 million hectares.
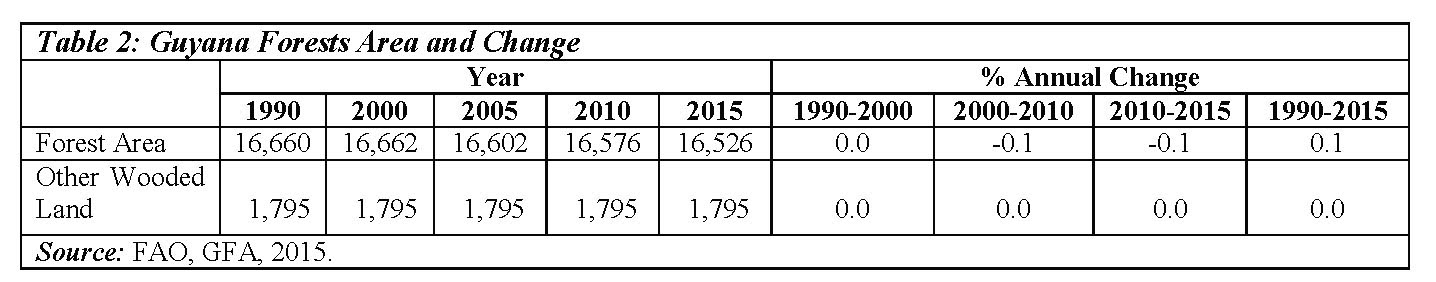
Changes to these totals over the period 1990-2015, have been negligible, as revealed in Table 2.
The FAO, GFA 2015 also report 39.2 per cent of Guyana’s forest area is constituted of “primary” (or old growth) forest, and the remaining 60.8 per cent is comprised of “other naturally regenerated” forest cover. Further, the GFA lists zero acreage for planted forests in Guyana.
Next week I shall provide additional information on salient indicators/descriptors of Guyana’s forests.