In this second part, I want to start addressing some of the possible causes of the depreciation of the foreign exchange rate  since 2015. However, we must first take stock to see whether the economy is indeed not generating enough foreign currencies. In 2007, the BOG held US$254 million in net international reserves. This number reached its peak of US$825 million in 2012. It has subsequently declined, reaching its lowest value of US$595 million in 2015. The reserve level increased marginally in 2016, but fell to US$598 million at the end of February 2017.
Overall, these numbers exceed the three months of import cover, which is typically an international benchmark that says the central bank has enough reserves to support imports for three months.
The commercial banks also hold foreign reserves that are also known as net foreign assets (NFAs). These transactions are necessary for servicing the international transaction needs of customers.
The commercial banks by 2007 held US$189 million in NFAs and this number increased to its highest value of US$294 million in 2014. NFAs of commercial banks declined by US$20 million in 2015, but subsequently increased to US$282 million in February 2017. Therefore, while the central bank has seen its foreign reserves decline, the commercial banks have increased theirs, even as imports decline (see below).
Publicly available data on the buying and selling exchange rates of commercial banks and non-banks are not available.
Knowing these numbers would provide useful information of where are the pressure points in the market. Nevertheless, we have data on the amount of foreign currencies the banks and non-bank cambios purchased and sold in 2015 and 2016. The table presented provides a summary.
Try to understand what these numbers are measuring. The amount of foreign exchange available to the Guyanese market (ex post) comes from exports, capital inflows, grants, remittances, etc. The sales of FX are for the purposes of imports, repayment of debt, and in general, sending mon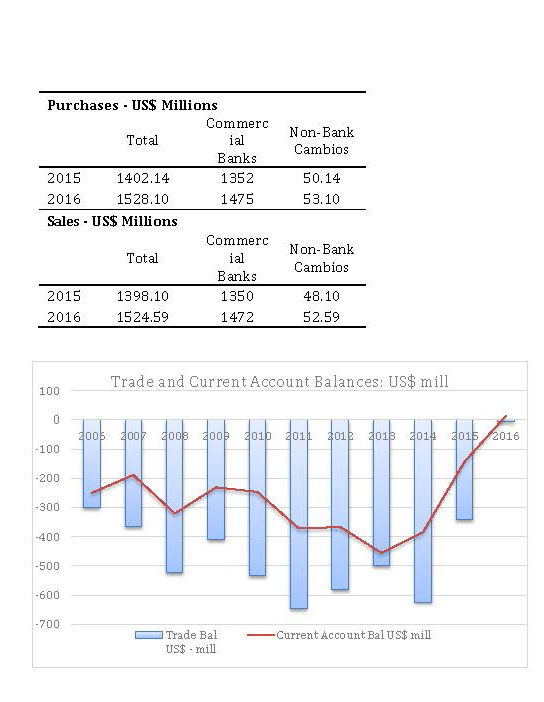 ey overseas.
The purchase numbers imply that the Guyanese economy is increasing its earning of foreign exchange. The purchases increased from US$1.402 billion in 2015 to US$1.528 billion in 2016, thus indicating a rise of 8.98%. On the other hand, sales of foreign currencies rose by 9.05%.
This does not appear like a market that is not generating hard currencies, albeit these purchases-sales numbers are for end 2016. Perhaps things have reversed dramatically by April 2017.
One other point of note from the table: commercial banks continue to be the dominant buyers and sellers of foreign currencies, accounting for almost 97% of purchases and sales. This is important to consider as the Bank of Guyana deploys moral suasion to stabilize the exchange rate. The BOG would need to convince the price leaders in the imperfectly competitive FX market (oligopoly) that it is in their interest to maintain a stable rate, possibly taking the rate to the mentally appealing G$200 to one US$.
Since these statistics do not indicate a severe collapse of foreign currency earnings by the economy, then why is the foreign exchange rate depreciating? Why are there constant anecdotes of shortages? That is what we are trying to find out in these columns. The next piece of information to consider as we unravel this puzzle is the merchandise trade balance (the difference between exports and imports) and the current account balance. The current account encompasses the merchandise trade, remittances and net incomes (interest and profit outflows).
The result is stunning as indicated by the bar and line chart. Both balances have improved considerably in recent years. The trade deficit of US$300 mill in 2006 widened further to US$645 million by election year 2011, but subsequently improved significantly to a small deficit of US$7.2 million by 2016. The turnaround in the merchandise trade balance started in 2014.
The current account deficit, as one would expect, follows a similar time path. The deficit reached its highest absolute value of US$456 in 2014 and subsequently improved to reach a small surplus of US$13 million as at end 2016. Therefore, neither the trade nor current account deficits are consistent with a foreign exchange market that should be under severe pressure, thus making this a very interesting puzzle.
There are two main factors accounting for the significant turnaround in the current account and trade deficits: (i) the increase in gold exports and (ii) the steep decline in the fuel import bill. The increased gold production and export would indicate some domestic policy decisions allowing new large-scale miners to enter exploration during the PPP years, the environmental problems notwithstanding. On the other hand, the decline in the world oil price, hence the import cost, presents a case of good luck.
Export revenues from gold in 2016 amounted to an unprecedented US$831 million, representing a whopping 66% increase over the 2015 revenue. This increase far exceeded the joint loss of US$59 million in bauxite, sugar and rice exports for same period. Meanwhile, the import of fuels declined to US$344 million in 2016. This number was higher in 2015 at US$367 million. However, this is still significantly lower than the recent peak of US$638 million recorded in 2012. Therefore, the fuel import bill has been declining since 2012.
There are also several secondary factors – both promising and worrying – accounting for the favourable outcome in the current account and merchandise trade balances. The first, indicating a promising structural shift in the economy, is the substantial increase in shrimp and rum exports since 2011. Shrimp export increased from US$64 million in 2011 to US$83 million in 2016, thereby exceeding sugar – once the king – export of US$73 million. The second promising shift is the increase of rum export from US$6.4 million in 2011 to US$37 million in 2016. Rum, in case we forget, requires an industrial process and is a byproduct of sugarcane.
There are however a few troubling trends lurking underneath the improvement in the trade and current accounts. These statistics signal a weakening of confidence or animal spirits, thus presenting insights as to why the exchange rate is depreciating while the economy is earning sufficient foreign exchange. The first clue is the decline in the import of consumer goods since 2012, when its recorded import was US$466 million. The import of consumer goods was US$422 million in 2016.
Even more troubling is the decline in the import of capital goods (machines, spare parts, factory materials, etc), which recorded US$460 million 2012 and fell significantly to US$321 million by 2016. A similar pattern occurs with respect to the import of intermediate goods – goods used to produce other goods and services – which declined from US$424 million in 2012 to US$371 million in 2016. These patterns likely reflect the waning of economic sentiments given the tit-for-tat political tussles since the 2011 election. When confidence is weak, people will look for safe assets to preserve their hard-earned savings. They will be less likely to import things for production. Foreign exchange is a safe asset.
It appears, therefore, that people are choosing to hold on to their hard currencies. When this is the case they desire a higher price, in terms of G$, to part with them. People are hoarding because they are scared of something. We would explore in a future column what this something represents.
In the next column, we will answer the question whether the “slowdown” of “drugs money” has anything to do with the FX market pressure.
Comments: tkhemraj@ncf.edu