Stock market updates
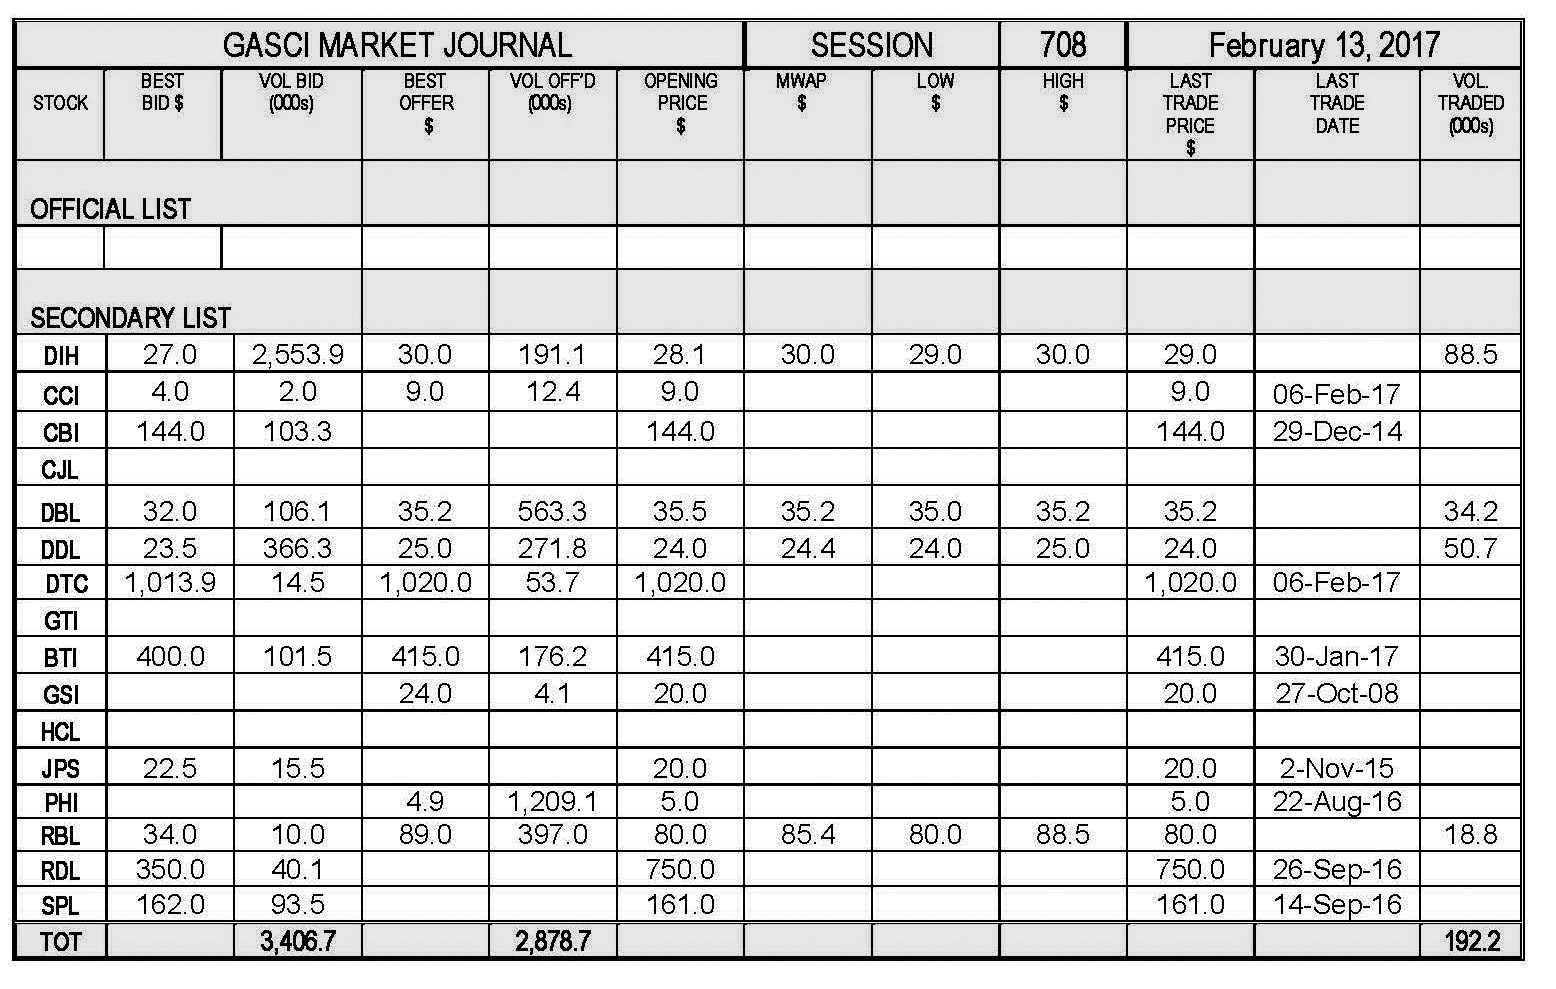
GASCI (www.gasci.com/telephone Nº 223-6175/6) reports that session 708’s trading results showed consideration of $6,697,402 from 192,218 shares traded in 21 transactions as compared to session 707’s trading results, which showed consideration of $3,615,478 from 101,131 shares traded in 15 transactions. The stocks active this week were DIH, DBL, DDL and RBL.
Banks DIH Limited’s (DIH) six trades totalling 88,500 shares represented 46.04% of the total shares traded. DIH’s shares were traded at a Mean Weighted Average Price (MWAP) of $30.0, which showed an increase of $1.9 from its previous close of $28.1. DIH’s trades contributed 39.61% ($2,652,700) of the total consideration. DIH’s first two trades totalling 50,000 shares were traded at $30.0, while its third trade of 1,534 shares was at $29.0, its fourth and fifth trades totalling 36,200 shares were at $30.0, while its sixth trade of 766 shares was at $29.0.
Demerara Bank Limited’s (DBL) three trades totalling 34,200 shares represented 17.79% of the total shares traded. DBL’s shares were traded at a Mean Weighted Average Price (MWAP) of $35.2, which showed a decrease of $0.3 from its previous close of $35.5. DBL’s trades contributed 17.97% ($1,203,640) of the total consideration. DBL’s first trade of 1,000 shares was at $35.0, while its second and third trades totalling 33,200 shares were at $35.2.
Demerara Distillers Limited’s (DDL) eight trades totalling 50,718 shares represented 26.39% of the total shares traded. DDL’s shares were traded at a Mean Weighted Average Price (MWAP) of $24.4, which showed an increase of $0.4 from its previous close of $24.0. DDL’s trades contributed 18.51% ($1,239,462) of the total consideration. DDL’s first six trades totalling 22,230 shares were at $25.0, while its seventh and eight trades totalling 28,488 shares were at $24.0.
Republic Bank Limited’s (RBL) four trades totalling 18,800 shares represented 9.78% of the total shares traded. RBL’s shares were traded at a Mean Weighted Average Price (MWAP) of $85.4, which showed an increase of $5.4 from its previous close of $80.0. RBL’s trades contributed 23.91% ($1,601,600) of the total consideration. RBL’s first trade of 2,000 shares was at $85.0, its second trade of 10,000 shares was at $88.5, its third trade of 1,300 shares was at $82.0, while its fourth trade of 5,500 shares was at $80.0.
Best bid: The highest price that a buyer is willing to pay for a security.
Best offer: The lowest price at which a seller is offering to sell securities.
TERM OF THE WEEK
Current Ratio: This is an accounting ratio, which is normally defined as current assets divided by creditors falling due within one year. It is designed to assess short term company solvency. Put simply, if it exceeds one, then the value of current assets is larger than the value of the short term creditors, indicating that the company is able to pay its short term debts as they fall due.
Source: Dictionary of Financial and Securities Terms.
Contact Information: Tel: 223–6175/6
Email: info@gasci.com
gasci@networksgy.com
Website: www.gasci.com
The market information provided here is provided for informational and educational purposes only and is provided on a time-delayed basis. GASCI does not guarantee the accuracy or completeness of any information contained on this page. Although the information has been obtained by GASCI from sources believed to be reliable, it is provided on an “as is” basis without warranties of any kind. GASCI assumes no responsibility for the consequences of any errors or omissions. GASCI does not make or has not made any recommendation regarding any of the securities issued by any of the companies identified here nor the advisability of investing in securities generally for any particular individual.
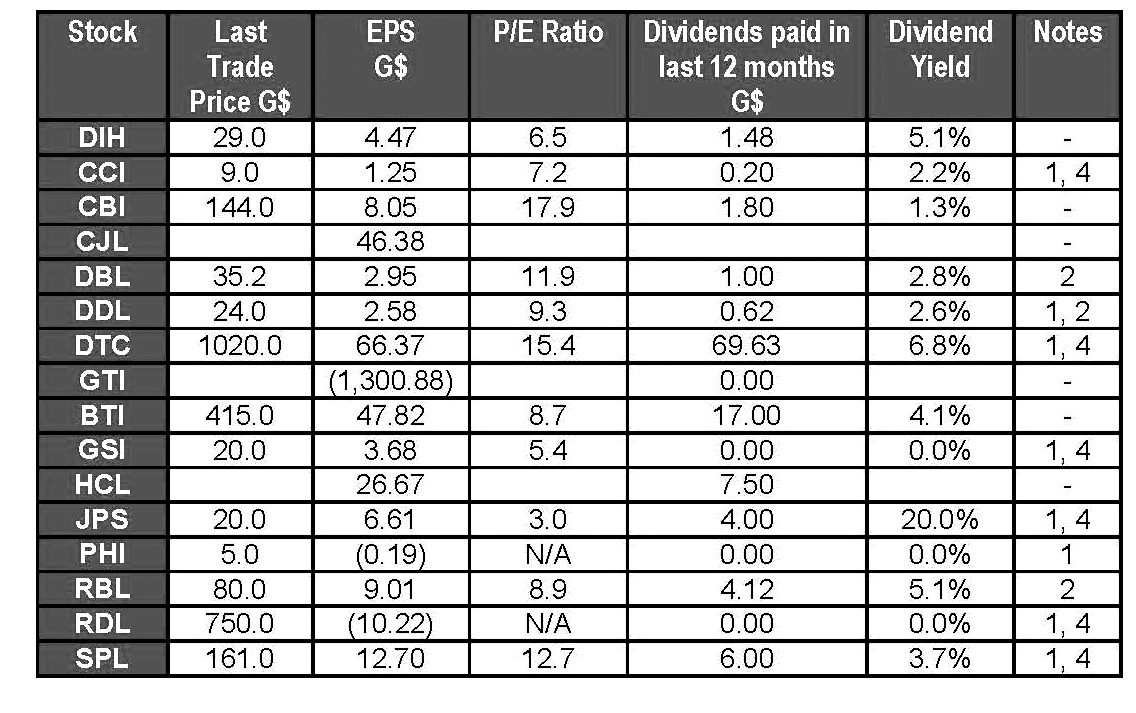
Notes
1 – Interim Results
2 – Prospective Dividends
3 – Shows year-end EPS but Interim Dividend
4 – Shows Interim EPS but year-end Dividend
EPS: earnings per share for 12 months period to the date the latest financials have been prepared. These include:
2005 – Final results for GTI.
2013 – Final results for CJL.
2015 – Final results for BTI and GSI.
2016 – Interim results for DTC, CCI, DDL, HCL, JPS, PHI, RDL
and SPL.
2016 – Final Results for DIH, CBI, DBL and RBL.
As such, some of these EPS calculations are based on un-audited figures.
P/E Ratio: Price/Earnings Ratio = Last Trade Price/EPS
Dividend yield = Dividends paid in the last 12 months/last trade price.