Various observations
Various observations about the Guyana economy have been made over the past year or so. Some observations were positive while others were negative. Some negative remarks included things like business was slow, the economy was slow and money was not flowing. In addition, negative assumptions were made about the availability of foreign exchange and that there was a lack of confidence in the economy. These views might have been compounded by the low rate of spending of the capital budget of the government last year and the closing or scaling-down of operations of a few businesses. In addition, some publicly-controlled industries did not do as well as they could have, stemming from a variety of factors which included low export prices and low levels of output. Further,  the Guyana economy was adjusting to some new economic and social realities which required businesses to adjust their business models. Businesses could no longer rely on unorthodox accounting and valuation techniques and a network of unprincipled public officials that gave some advantages over others. The ability to influence the rate and size of cash outflows with the use of questionable business practices are being curbed and have forced some businesses to alter their spending habits. At six months into 2017, one must wonder about the future of the Guyana economy and the condition of businesses. This article seeks to consider those issues.
Not homogeneous
Even though growth is projected over three per cent in 2017, one must hasten to point out that the Guyana economy is not a homogeneous one. It is made up of large and small businesses found in the various sectors of the economy. It is made up also of private businesses and public enterprises that operate in the market. Some are more export-oriented while others depend heavily on the domestic market. Many public enterprises, such as GPL, GuySuCo and Guyoil, exert significant influence on the economy. They are all foreign dependent, either on the export or import side of the trade table. Some businesses have the ability to invest in foreign markets while others are limited to the investment choices at home. Clearly, the opportunities to manage risk through product and market diversification and even through price adjustments vary from business to business and with the level of competition in the given industry. It gives some a competitive advantage and others a handicap. Naturally, performance among businesses, industries and sectors will vary. Conducting the business analysis for an entire economy is not a simple task, let alone putting it into a short article of this sort. Fortunately, there are tools that are available to facilitate the assessment effort, even though they might not enable coverage of the entire range of issues of interest to many.
One of those tools is the stock market index which is prepared by this writer. It is not uncommon to use the market capitalization in economic and business analysis. Linked to the index is the market capitalization to GDP ratio which enables one to develop perspectives about market value and economic performance. Several interpretations are given to the market cap-GDP ratio. Those who have written about the market cap-GDP ratio and its relationship to stock value have drawn the conclusion that when the market value of stocks exceeds 100 per cent the stocks more likely than not are overvalued. They have also drawn the conclusion that when the ratio is below 50 per cent, the stocks are highly undervalued. With a market cap to GDP ratio of 22 per cent, one could conclude that the stocks on the Guyana Stock Exchange are significantly undervalued. This level of valuation offers one comfort that there is substantial room for growth across all sectors. The industry analysis provided later on might limit the optimism induced by the low value of the stocks.
Other use
The other use of the market cap to GDP ratio is the one that generates an even greater amount of debate. This refers to the market-cap playing the role of a leading economic indicator. The direction in which the market cap goes reflects both the confidence that people have in the economic ability of the companies and the view that the companies have about themselves and the Guyana economy as a whole. The two views are best obtained by observing the trends in the stock index. The Lucas Stock Index (LSI) is made up of nine of the 16 existing companies in the market. The index therefore accounts for about 56 per cent of the companies that are on the exchange. The index contains companies that operate in two of the four sectors of the economy, namely manufacturing and services. It therefore excludes agriculture and mining and their associated industries. However, the two sectors represented in the Index account for at least 60 per cent of the GDP of the country. Notwithstanding its limitations, the LSI provides a good indication of the behaviour of the market.
The market value of the Index as at the second trading period of June 2017 was $159.3 billion. In other words, it is what someone would have to pay for the nine companies if he or she wanted to buy them all at this point in time. This capitalization represents an increase of 13 per cent in the value of the Index from one year ago. For the six months measured from mid-December 2016 to mid-June 2017, the Index has risen 15 per cent. These positive movements in the value of the stocks are typically viewed as businesses having confidence in the future of the economy. This is not an unreasonable viewpoint to hold since the production structure of Guyana is poised to undergo radical reform and improvement with the addition of oil and gas, the restructuring of the sugar industry and the push to widen the agricultural base of the economy. The oil and gas sector has begun to attract interest and investments from both local and foreign investors that are new to the Guyana economy. Existing companies are also seeking to position themselves to take advantage of the opportunities that oil and gas bring to the economy. Significant interest is also being shown in the agricultural sector while the mining sector continues to perform with vigour.
Sectoral analysis
The sectoral analysis offers a different perspective of things. The manufacturing sector accounted for 29 per cent of the value of the Index at mid-June 2016. By mid-December that share had risen to 32 per cent and now stands at 36 per cent of the Index value. Conversely, the share of the services sector in the value of the Index declined by the same percentage size. The growth in market value exhibited by the manufacturing sector was significant. It grew by 16.58 per cent from mid-June 2016 to mid-June 2017 and by 14 per cent from mid-December to mid-June 2017. The services sector exhibited much slower growth during the same time periods. It grew by less than one per cent in the period mid-June 2016 to mid-June 2017 and by 5.2 per cent in the shorter time-period of mid-December 2016 to mid-June 2017. As a consequence, the manufacturing sector is projected to expand its contribution to the GDP from six per cent to eight per cent while the contribution of the services sector would remain constant.
If one were to use the valuation of the manufacturing companies against the contribution of the manufacturing sector to GDP, it could give rise to a difference about the valuation of the stocks. The manufacturing data used excludes the contribution of rice and sugar. So, the focus is on other manufacturing which is where beverages and other products are measured. When measured against the adjusted manufacturing GDP, the companies in the manufacturing sector might be significantly overvalued while those in services are woefully undervalued.
Aggregate numbers
Another thing about the aggregate numbers is that they can mask the impact that industries might have on the values. The beverage industry dominates the manufacturing sector. It accounts for 93 per cent of the value of the sector in the Index with the result that the growth in the sector is reliant on the performance of the beverage industry. Even within that small grouping, significant variations can be observed. For example, the value of the Index has been influenced by the performance of Banks DIH stocks. It grew 73 per cent from June 2016 to June 2017 and by 55 per cent from December 2016 to June 2017. During the same time periods, DDL stocks grew 12 per cent and nine percent respectively. The stocks of the other two manufacturing companies, CCI and SPL, remained virtually unchanged. If these variations reflect economic behaviour, then it is obvious that not all parts of the manufacturing sector are performing the same.
The situation in the services sector is even more telling. The industries in the service sector that make up the LSI are more homogeneous which means that the same factors should affect the companies. Four of the five companies are commercial banks while one provides distribution services. One observes extreme performance in the services sector as was the case with the manufacturing sector. The performance of most of the commercial banks was flat with the result that the value of the companies in the services sector grew less than one per cent from mid-June 2016 to mid-June 2017. However, one company, Republic Bank, gained 24 per cent in the six-month period. DBL gained seven per cent in the same time-period. The mixed behaviour of the stocks seems to suggest that the performance of the economy was likely to be variable.
Management competence
One has got to keep in mind that the performance of companies is also a consequence of the competence of their management. Poor performance is not always a result of the condition of the economy. It is also about good decision-making, good risk management and good internal controls. In essence, it is about good leadership. Good leadership adds value to a company all the time. Poor leadership does not.
LUCAS STOCK INDEX
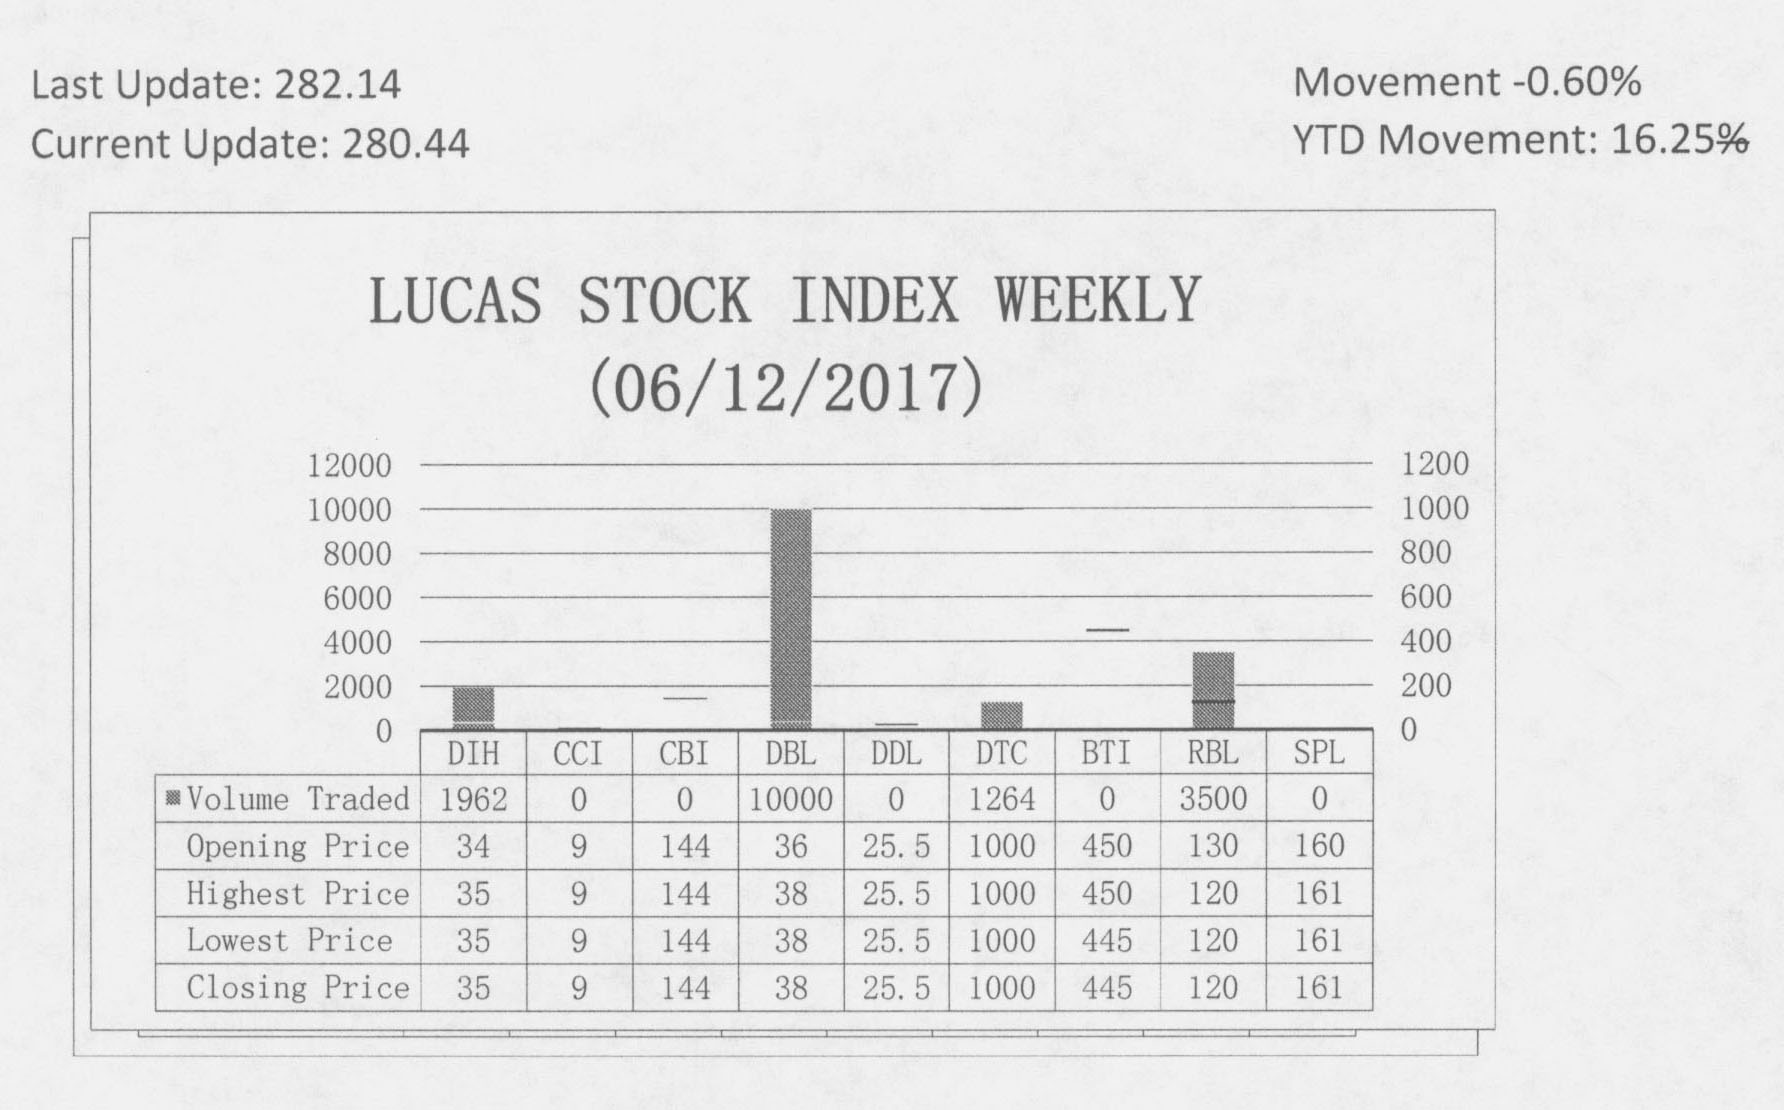
The Lucas Stock Index (LSI) declined 0.60 percent during the second period of trading in June 2017. The stocks of four companies were traded with 16,726 shares changing hands. There were two Climbers and one Tumbler. The stocks of Demerara Bank Limited (DBL) rose 5.56 percent on the sale of 10,000 shares and the stocks of Banks DIH (DIH) rose 2.94 percent on the sale of 1,962 shares. On the other hand, the stocks of Republic Bank Limited (RBL) fell 7.69 percent on the sale of 3,500 shares. In the meanwhile, the stocks of Demerara Tobacco Company (DTC) remained unchanged on the sale of 1,264 shares.