Introduction
Since its appearance in mid-March several readers (I suspect largely students) have been urging me to appraise and/ or review the recent financial modeling exercise carried in sections of the media, and which has been conducted by Open Oil, on Guyana’s 2016, production sharing agreement, PSA. Before turning to the next topic in the ongoing series on the PSA’s fiscal regime, I shall attend to this request, starting today. This task should take 2- 3 columns to complete. I do this in particular, because readers seemed to be intimidated by the financial modeling and all that implies in terms of rigor, precision, and the inevitable use of technical/ mathematical processes.
Open Oil’s modeling exercise has been published under what is perhaps a contentious or even provocative title: “Guyana’s oil deal is outlier low government takes just over half”. Its contents, as I shall demonstrate, however, portend this as an unjustified prediction. The local media have been harsher, with such titles as: “Analyst says…Oil deal with Exxon Mobil could cost Guyana $$ billions” Kaieteur News, March 20, 2018.
Background
Some background would be useful here. On March 15, 2018, Open Oil’s website, left open for public comment, its publication cited above. This has since been closed. However, comment for the benefit of the Guyanese public, I believe, is still appropriate, since this publication illustrates both the strength and power of this sort of approach, as well as its severe limitations for predictive certitude of the outcome (at this stage) of Guyana’s coming time of oil and gas production and export.
The author of the study (Johnny West) is both the Head and Founder of Open Oil. This organization is perhaps the most well- known, as well as perhaps also the most celebrated in this field among non- governmental bodies (NGOs), and developing and emerging economies worldwide. Open Oil’s declared Mission is “to create an open data framework for managing natural resources at a supranational level”. It asserts this Mission is justified because 1) this is the only way (my emphasis) of securing long-term sustainability” 2) of increasing the role of cost- benefit analysis and, 3) ensuring transparency. It is for such reasons that Open Oil further claims it offers unique specialized training and consultancy services to governments, international organizations, businesses, and NGOs. Open Oil therefore, offers its services for sale as an equal opportunity businesses and consulting group.
Later I shall, demonstrate in greater detail (for the benefit of non- specialist readers) that Open Oil has developed its own financial model called the FAST Modeling Standard. This model was employed in the exercise for Guyana’s 2016 PSA. But first a summary description.
Fast Standard
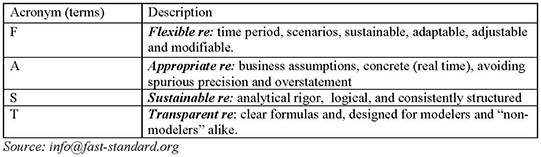
FAST is Open Oil’s acronym for its financial modeling of the hydrocarbons sector. A summary description of what FAST stands for is presented in Schedule 1 below: F reflects the aim of making the model flexible and in so doing making it easily adapted, adjusted and modified to deal with the specifics and particularities of the sub- sector, under analysis. A reflects the emphasis on appropriateness, particularly as businesses and governments have to operate under real- time conditions and assumptions. S reflects the model’s aim to be sustainable, under rigorous analysis. T reflects that there are transparent, clear, and unambiguous formulae and relationships. These are designed for the benefit of both modelers and “non- modelers” alike.
Appraisal & Review
My approach to the task of appraising/ reviewing Open Oil’s Financial Modeling of the Guyana’s PSA is straightforward. First I shall provide a summary description of the key features of the financial model. Second, after that, I provide details of the results that have been obtained from the modeling exercise. Third, following that, I finally evaluate/ assess the results as an indicator of future outcomes.
Context
First the context. The model is premised on the fact that this is the first oil field to be developed in Guyana. The financial modeling exercise is based on the 1999 Agreement signed with Exxon. It took from 1999 until 2008, for exploration to effectively commence. The first significant discoveries were not made until March 2015. Following this, the 1999 Agreement was later revised in 2016.
Legally, Exxon is the lead operator, holding a 45 percent stake. Exxon operates through Esso Exploration and Production Guyana Limited (EEPGL) along with two other corporations: Hess Corporation through Hess Guyana Exploration holding, 30 percent; and CNOOC, Nexxen Petroleum Guyana, holding 25 percent. The above therefore delineates the lease, exploration, and development phases of the project’s life cycle leading into the production phase.
Constructed in 2018, the model recognizes that the contractor had by then declared finds of 3.2 billion barrels of recoverable reserves. The model however, is focused on the first field. That is, the Liza 1 discovery of recoverable resources of around 450 million barrels of oil. The model is based on this field, whose production life starts circa 2020. Thereafter production to final de- commissioning is modeled from 2020 to 2040. The project’s life cycle is therefore four decades, 1999- 2040.
The field’s production function envisages offshore production, utilizing a Floating Point Storage Operation, located offshore Guyana. This operation takes one year to ramp- up and subsequently six years to reach maximum output, then plateauing. Thereafter, production falls and the model sets the annual average rate of decline at 12.5 percent. Following this, de- commissioning of the field commences.
The price of crude oil used in the model is the February2018, Energy Information Agency’s (EIA) forecasted reference price to 2050. This is applied as a constant price per barrel. Estimates are: exploration cost is given as US $500 million, development cost US $4.4 billion, decommissioning cost US $ 980 million, operating cost US $ 3.7 billion. All these costs are based on Exxon’s public declarations. Of significance, given the local debates on leveraging and thin capitalisation, the model assumes zero project financial costs.
Conclusion
Next week I continue this description of the model beginning with its projected government revenue flows.