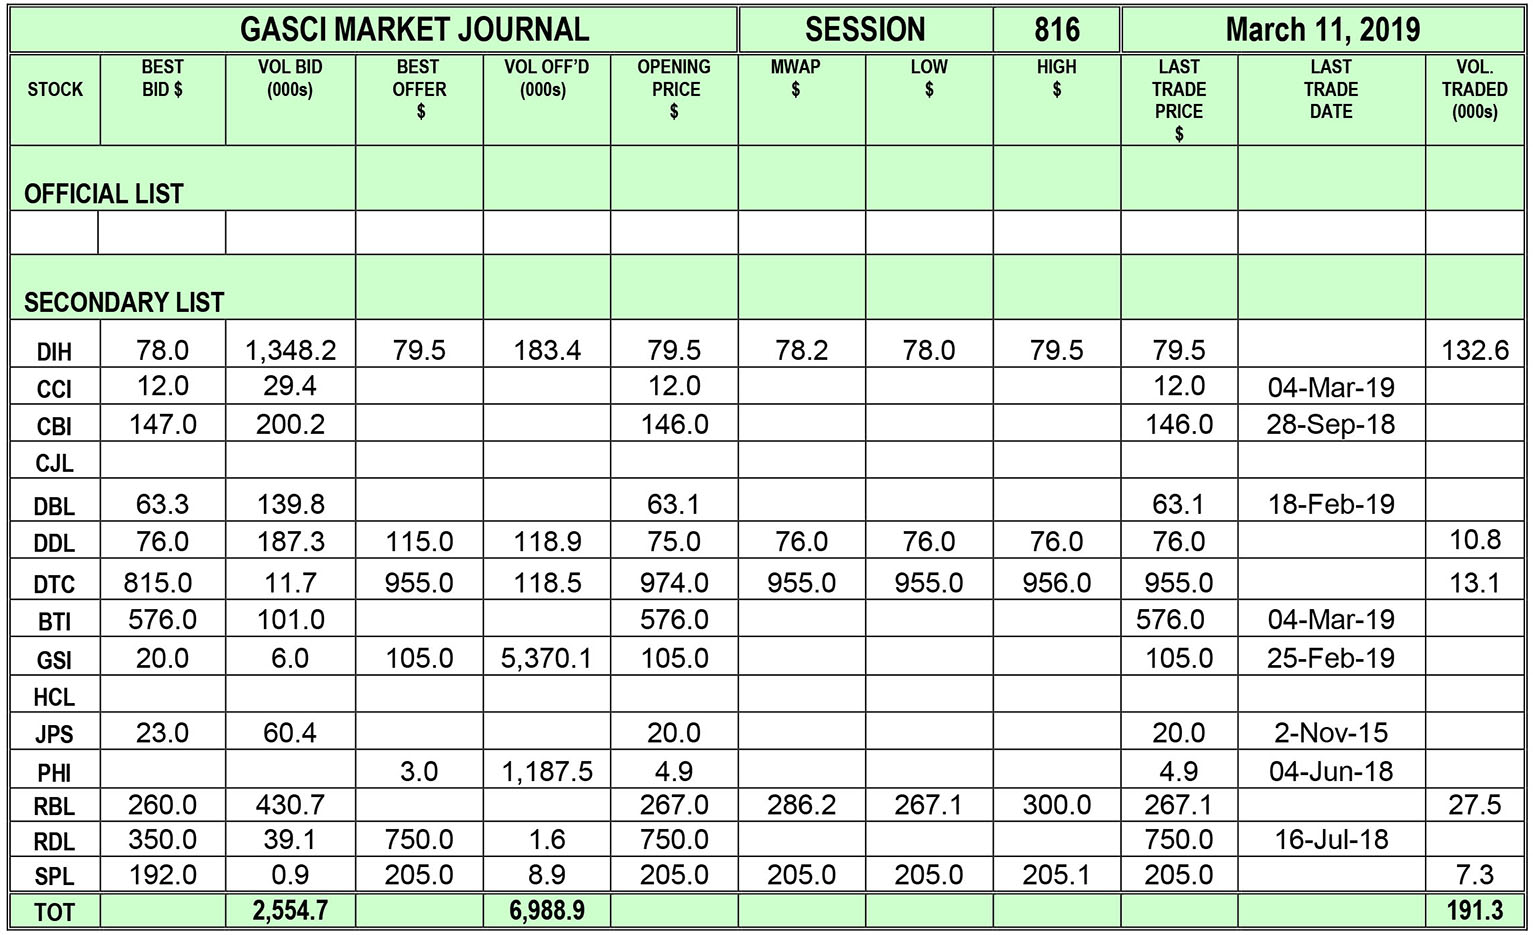
GASCI (www.gasci.com/telephone Nº 223-6175/6) reports that session 816’s trading results showed consideration of $33,041,257 from 191,293 shares traded in 23 transactions as compared to session 815’s trading results which showed consideration of $29,862,762 from 321,639 shares traded in 25 transactions. The stocks active this week were DIH, DDL, DTC, RBL and SPL.
Banks DIH Limited’s (DIH) six trades totalling 132,551 shares represented 69.29% of the total shares traded. DIH’s shares were traded at a Mean Weighted Average Price (MWAP) of $78.2, which showed a decrease of $1.3 from its previous close of $79.5. DIH’s trades contributed 31.35% ($10,358,923) of the total consideration. DIH’s first trade of 89,201 shares was at $78.0, its second trade of 200 shares was at $78.1, its third trade of 29,800 shares was at $78.0, its fourth trade of 1,000 shares was at $79.4, while its fifth and sixth trades totalling 12,350 shares were at $79.5.
Demerara Distillers Limited’s (DDL) two trades totalling 10,836 shares represented 5.66% of the total shares traded. DDL’s shares were traded at a Mean Weighted Average Price (MWAP) of $76.0, which showed an increase of $1.0 from its previous close of $75.0. DDL’s trades contributed 2.49% ($823,536) of the total consideration. Both of DDL’s trades were at $76.0.
Demerara Tobacco Company Limited’s (DTC) five trades totalling 13,096 shares represented 6.85% of the total shares traded. DTC’s shares were traded at a Mean Weighted Average Price (MWAP) of $955.0, which showed a decrease of $19.0 from its previous close of $974.0. DTC’s trades contributed 37.85% ($12,506,698) of the total consideration. DTC’s first trade of 5,950 shares was at $955.0, its second trade of 18 shares was at $956.0, while its third to fifth trades totalling 7,128 shares were at $955.0.
Republic Bank (Guyana) Limited’s (RBL) five trades totalling 27,500 shares represented 14.38% of the total shares traded. RBL’s shares were traded at a Mean Weighted Average Price (MWAP) of $286.2, which showed an increase of $19.2 from its previous close of $267.0. RBL’s trades contributed 23.77% ($7,853,250) of the total consideration. RBL’s first trade of 10,000 shares was at $300.0, its second and third trades totalling 10,000 shares were at $285.0, while its fourth and fifth trades totalling 7,500 shares were at $267.1.
Sterling Products Limited’s (SPL) five trades totalling 7,310 shares represented 3.82% of the total shares traded. SPL’s shares were traded at a Mean Weighted Average Price (MWAP) of $205.0, which showed no change from its previous close. SPL’s trades contributed 4.54% ($1,498,850) of the total consideration. SPL’s first trade of 3,000 shares was at $205.1, while its second to fifth trades totalling 4,310 shares were at $205.0.
Best bid: The highest price that a buyer is willing to pay for a security.
Best offer: The lowest price at which a seller is offering to sell securities.
TERM OF THE WEEK
Emerging Markets: A term which refers to newer securities markets. Generally these may be relatively illiquid, under-regulated, with poor settlement systems etc. but have attracted high levels of cross-border investment because of their perceived long-term attractions.
Source: Dictionary of Financial and Securities Terms.
Contact Information:
Tel: 223 – 6175/6
Email: info@gasci.com gasci@networksgy.com
Website: www.gasci.com
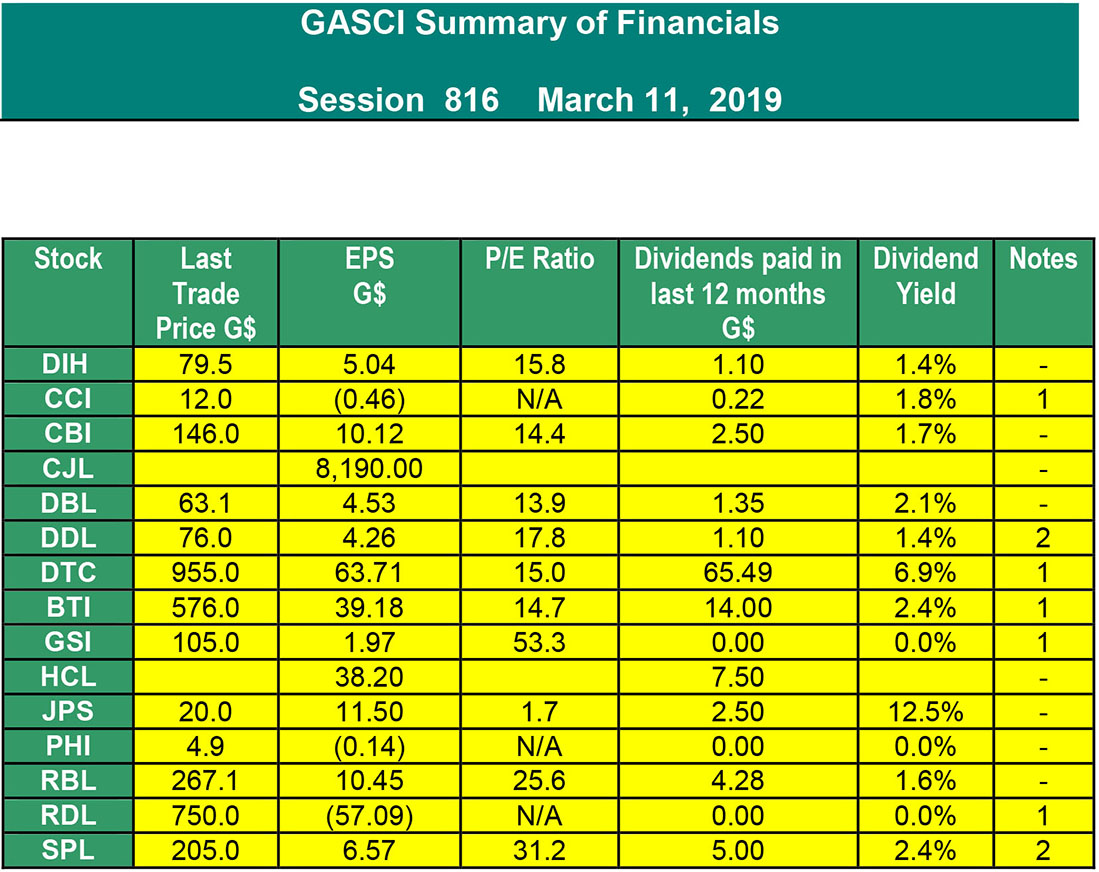
Notes
1 – Interim Results
2 – Prospective Dividends
3 – Shows year-end EPS but Interim Dividend
4 – Shows Interim EPS but year-end Dividend
EPS: earnings per share for 12 months period to the date the latest financials have been prepared. These include:
2016 – Final results for CJL and PHI.
2017 – Final results for HCL and JPS.
2018 – Interim results for CCI, DTC, BTI, GSI and RDL.
2018 – Final Results for DIH, CBI, DBL, DDL, RBL and SPL.
As such, some of these EPS calculations are based on un-audited figures.
P/E Ratio: Price/Earnings Ratio = Last Trade Price/EPS
Dividend yield = Dividends paid in the last 12 months/last trade price.
The market information provided here is provided for informational and educational purposes only and is provided on a time-delayed basis. GASCI does not guarantee the accuracy or completeness of any information contained on this page. Although the information has been obtained by GASCI from sources believed to be reliable, it is provided on an “as is” basis without warranties of any kind. GASCI assumes no responsibility for the consequences of any errors or omissions. GASCI does not make or has not made any recommendation regarding any of the securities issued by any of the companies identified here nor the advisability of investing in securities generally for any particular individual.