Introduction
Today’s column wraps up my consideration of a ballpark or indicative crude oil price that I project to prevail around the late 2020s. At that point in time, Guyana’s daily rate of production (DROP) is ramped-up, and projected output is in the daily range of 1.5 to 2.5 million barrels of oil. The Road Map uses this price to determine projected values for Guyana’s petroleum revenues.
This estimation determines the nominal annual average price. As readers were previously informed, the specific price for Guyana’s crude will finally depend on its particular specifications, not its generic category. As Exxon has indicated, this category is light sweet crude, with a high API and low Sulphur content. However, it is only after Guyana’s crude starts to flow into the market place that a “fix” on its price will be firmly established.
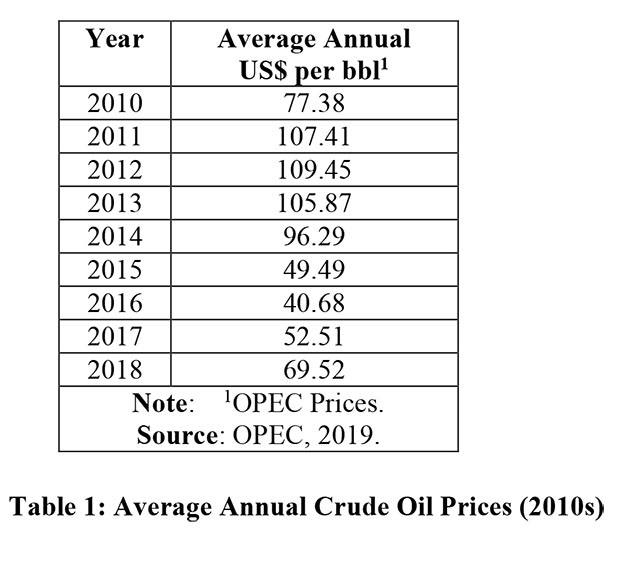
For purposes of this Road Map, I use the average annual OPEC crude oil price as the proxy indicator of global crude oil prices. Thus, last week’s example of global crude oil price variability is based on revealed OPEC crude oil prices. Average annual OPEC prices during the 2010s are indicated in Table 1. These show that, apart from their variability (highlighted last week), the price has been trending downwards over the 2010s, averaging about US$92 per barrel average for 2010/2011 to a low of approximately US$61 per barrel for the most recent two-year period, average, 2017-2018.
 Price Behaviour
At this juncture, it is useful to remind readers that economists model crude oil price behaviour as a function of two key variables: namely, the quantity demanded and the quantity supplied. Routinely, demand depends largely on: 1) purchasing power (and in turn this is dependent on incomes, wealth, and so on); 2) purchasers’ preferences (for example, oil versus other energy products); 3) the prices of close substitutes for oil (like coal and natural gas); 4) expectations about future prices; and 5) the number of potential buyers.
Similarly, quantities supplied are principally dependent on: a) production costs; b) access to petroleum reserves; c) expectations; and d) total supply. Economists also expect these demand and supply forces configure crude oil markets and their prices. However, as noted last week, crude oil is traded in such highly complex markets that, even these formidable forces do not fully satisfy. Last week I identified ten economic and five non-economic factors, which drive such markets!
Indicative Price (World Bank)
For, the remainder of today’s column I focus on detailing my estimation of the indicative crude oil price expected to be in force, on average, around the late 2020s. Given 1) the structure and organisation of the crude oil market, 2) the economic and non-economic drivers of this market (identified last week), and 3) its extreme volatility, I offer two projections. The first of these is the World Bank’s. Following this I offer my own. This latter was made as far back as 2016, and I remain confident of it.
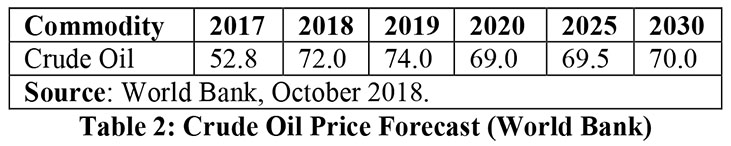
Reputationally, however, the World Bank’s crude oil price estimate is the global standard bearer. This is provided in its quarterly publication: Commodity Markets Outlook. Its most recent forecast (October 2018) is shown in Table 2 below.
When assessing crude oil prices over such a long forecast horizon, one has to make judgements and assessments on the course of future risks, bearing in mind the intrinsic uncertainty of oil market behaviour. Downside risks are those that depress oil prices. And, such risks are likely to entail some combination of falling demand and increasing supply, as well as their net effects. Upside risks, of course, relate to the reverse. That is, rising demand and reducing supply, and their net effects also.
Going forward upside performance focuses heavily on demand growth among emerging/ developing economies and lower global supply (as a result of energy policies and regulations), plus cartel behaviour by OPEC. Similarly, downside performance centres on falling demand in emerging/developing economies, combined with investment and expansion in OPEC, other global suppliers, and new discoveries like Guyana’s.
Indicative Price (Thomas)
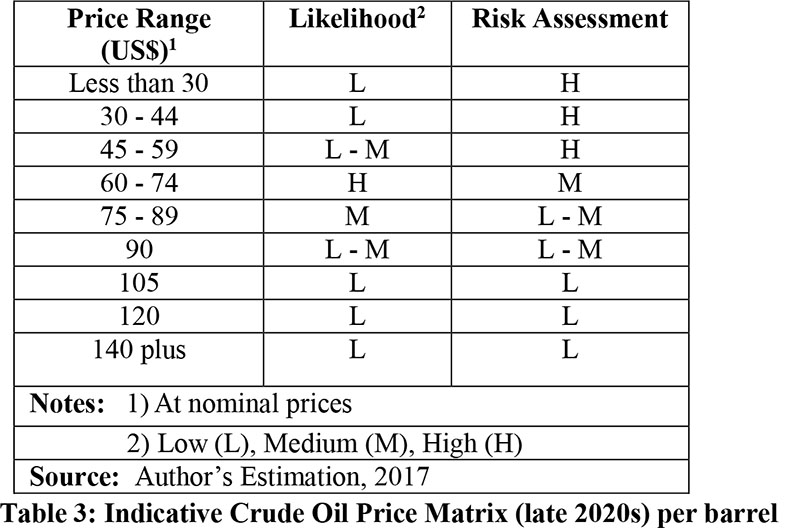
Following on these observations, I reproduce in Table 3 my estimation of the late 2020s indicative price matrix, offered previously (November 6, 2016), for the target crude oil price range. In the Table, price ranges are presented in units of US$15. The likelihood of each listed price range is rated on a scale of likelihood from low to high. This is indicated in the Table. The Table shows also the level of assumed risks facing the commercial viability and sustainability of Guyana’s oil and gas industry for the different price ranges.
My estimate shows the highest likelihood is for a price that falls between the two ranges, US$60-74 and US$75-89, with the lower range the more likely.
Clearly, my most likely estimate for the late 2020s closely approximates the World Bank’s. Of note, my estimate was originally made two years ago – 2016. It was re-affirmed one year later (2017); and again today.
Given the striking closeness of these two crude oil price estimates for the late 2020s, I feel confident in using US$70 per barrel for Guyana’s crude, as the nominal benchmark or indicative price for determining the values of Guyana’s crude oil production around the late 2020s.
Conclusion
Next week I move on to address the fourth Guidepost in the Road Map’s dimension for Guyana “getting petroleum revenues.” That is the “existential risk” Guyana’s petroleum sector faces going forward.