Introduction
Thus far, I have considered two of the six Guideposts in my depiction of a Road Map for the Government of Guyana (GoG) “getting its petroleum revenues” dimension. All the Guideposts in this dimension (“getting petroleum revenues”) seek to provide ball-park or indicative prices to be used for determining the value of total petroleum revenues. In so doing, such prices help determine projected gross resources likely to be available to Government for the “spending dimension” of the Road Map. The two Guideposts that have been addressed so far are: 1) fiscal revenue rules; and 2) likely petroleum reserves discovery/finds.
For the first Guidepost, the “ball-park” projection is Government Take of approximately 52%. I had labelled this estimate as being on the conservative end of available estimates. However, for the second Guidepost, my ball-park estimate is bullish. That is, 13 to 15 billion barrels of oil and between 21 and 42 billion cubic feet of natural gas and liquids. These are based on US Geological Survey data.
Today’s and next week’s columns seek to project a similar ball-park or indicative annual average price of crude oil over the period 2025 to 2030, or the late 2020s. It is during this period that I project Guyana’s crude oil production will be “ramped-up” and the daily rate of production (DROP) will climb to or surpass 1.5 to 2.5 million barrels of oil per day. To be sure, these projections assume ExxonMobil and Eco Atlantic will remain the leading operators/producers from now till the late 2020s. However, I firmly expect other producers will be heavily engaged in exploration and that this exploration will reveal onshore as well as offshore opportunities for finding commercial petroleum reservoirs.
Caution
A word of caution is appropriate at this juncture, as I do not want to appear overly deterministic, particularly as regards the estimation of the average annual indicative crude oil price, which I expect to be prevailing in the late 2020s.
There is a widely acknowledged adage in the petroleum industry that says: “things do not happen as we expect. In other words, things do not always go according to plan.” Some projections do not pan out, as less (or even far less) is achieved. While for some projections, more (or even far more) is achieved. I fully accept this adage. However, the adage applies to both upside and downside risks. And, as I have constantly highlighted in this series, the petroleum sector is notorious for such risks. And, because risk is so embedded in all petroleum activity, risk management and strategic approaches, such as Road Maps to guide and shape the long term vision, are essential.
Crude Oil Price
Crude oil prices have been notoriously variable. As an example over the period of the last seven years, the average annual OPEC price has ranged from a high of US$109.45 per barrel to a low of US$40.58 . Despite these swings in short-term prices, long run secular trends are discernible. Further, the crude oil price can be calculated as an average of the daily spot price; or the average of weekly, monthly, or quarterly prices. For the purposes of the Road Map, I shall rely on the average annual price. I have already dealt with these issues at length over the period September 4, to November 16, 2016 and again on August 6, 2017. It is, therefore, not necessary to repeat, except perhaps to highlight two considerations. First, the crude oil price (as indeed all other traded prices in the market place) is a function of both the quantity demanded and supplied. And, despite the complex structure of organised petroleum markets, this still holds true. Secondly, the role of “economic and non-economic drivers” determines the evolution of the crude oil price.
Role of “Economic” Factors
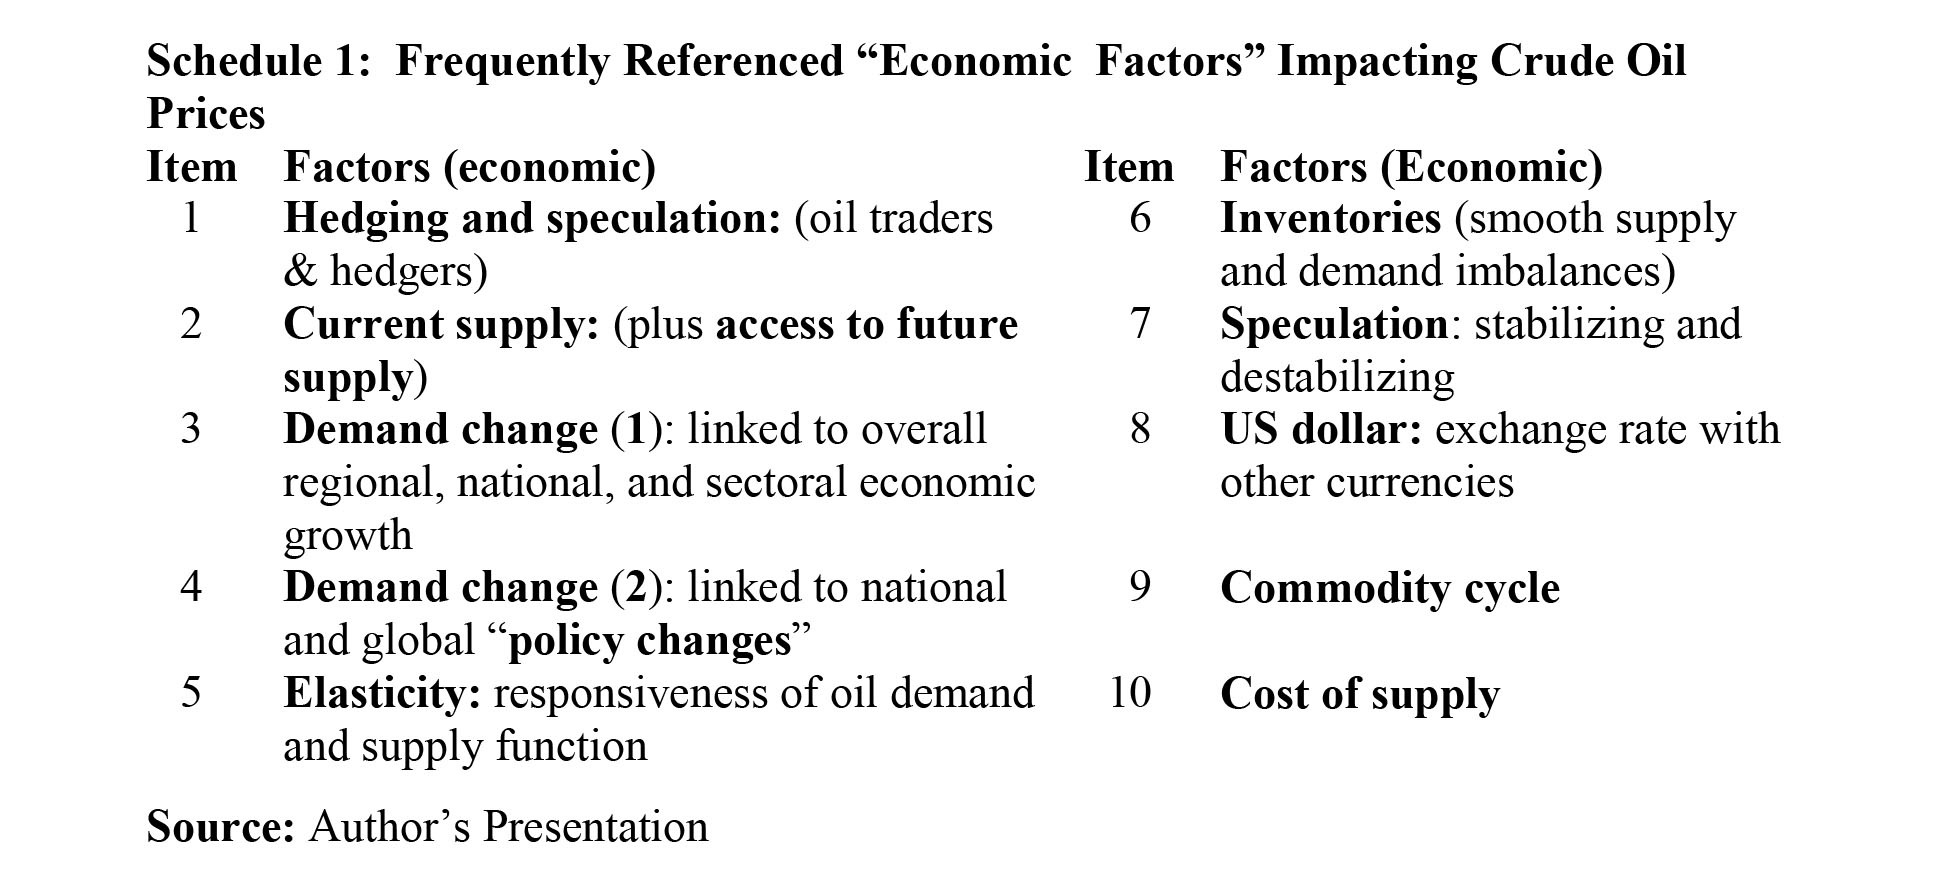
Schedule 1, from my earlier columns on this topic, presents a list of ten of the most frequently referenced “economic factors” affecting crude oil prices. These are: 1) hedging and speculating of commodity traders; 2) existing supply plus access to future supplies; 3) GDP, and its sectoral global, regional and national growth; 4) global and national regulatory policies/regulations; 5) responsiveness of supply and demand (elasticity)—the greater the elasticity, the easier for oil prices to clear market imbalances; 6) oil inventories (stocks) kept to smooth temporary imbalances in demand and supply; 7) stabilising speculation, which smooths demand and supply imbalances, and de-stabilizing speculation, which disrupts market operations and price formation; 8) crude oil prices are quoted in US dollars, making changes in the US exchange rate significant; 9) economists have empirically established that although their length varies, commodity prices behave in distinct long-term cyclical patterns; and, finally, (10) the cost of producing oil.
Role of Non-economic Factors
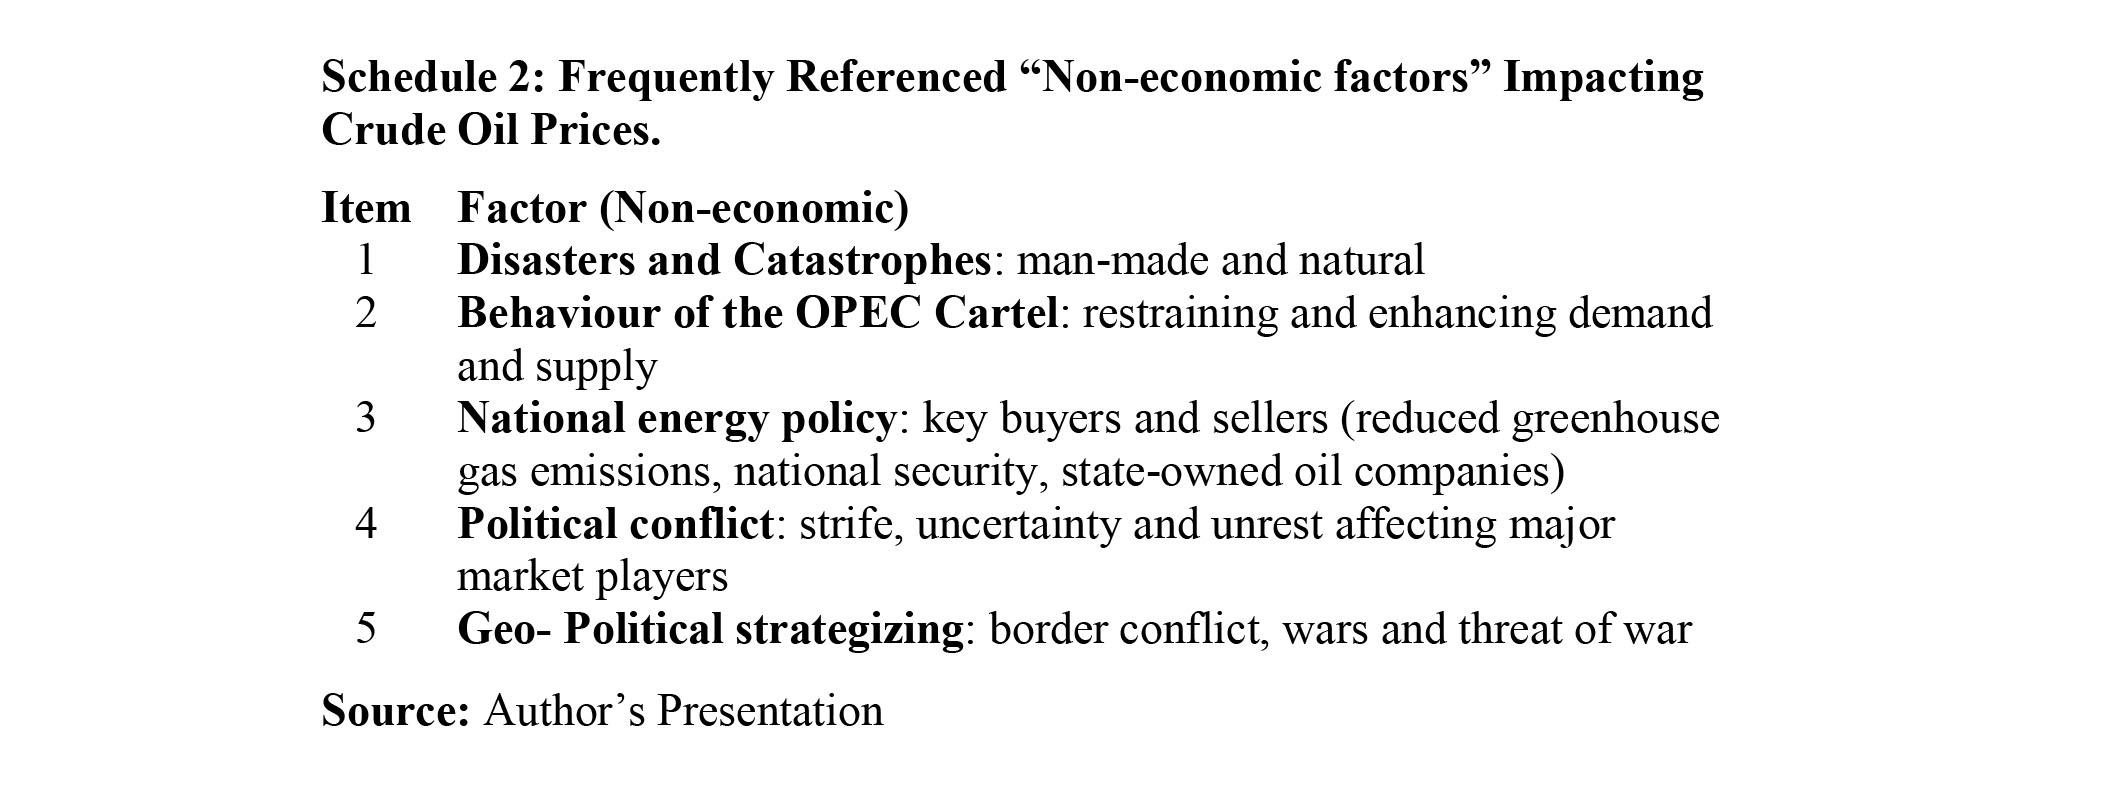
Schedule 2 also repeats the five “non-economic factors” previously highlighted. These are: 1) disasters and catastrophes (both man-made and natural); 2) operations of the OPEC cartel (Like all cartels, OPEC seeks to manipulate the market); 3) national energy policies pursued by major players and groupings of these players, as well as the international community; 4) global political conflicts which impact the global energy-mix; and, finally at a deeper level, the political factor morphs into (5) geo-political strategising of the major players in the oil market.
Conclusion
Next week I wrap-up this discussion of Guidepost 3. I shall offer readers my ball-park indicative price of crude oil I expect to prevail during the late 2020s.