Introduction
 Today’s column continues my presentation on Guidepost 6. As observed earlier, this Guidepost is crucial for my estimating Guyana’s anticipated petroleum revenues. It is a key metric for calculating the cost-price-profit profile of Guyana’s coming petroleum sector. Three of the observations, which were introduced last week, need to be reiterated at this juncture.
First, the cost-price-profit profile mentioned above is also the risk-reward profile for Guyana’s efforts to develop a petroleum sector. Second, the determination of the unit cost of production (or per barrel cost of oil and gas) is inextricably linked to the expected life cycles of the constructed wells, as these are represented in various petroleum projects. Third, it is immeasurably difficult to estimate the cost per barrel of oil and gas, with a high degree of accuracy, before any production and sale of crude oil and gas has actually commenced! It is for this particular reason, I had advised last week: “it is very difficult to fix this cost … in the absence of cooperation of the international oil companies (IOCs)” that are leading Guyana’s development of petroleum sector.
From the horse’s mouth
Given the above introductory observations, it is useful to begin today’s discussion, with an evaluation of the willingness of the leading IOC (ExxonMobil and partners) to report publicly, information on its projected unit cost.
Research reveals that, back in February 2018, Stabroek News had quoted extensively, an Exxon Vice-President in a report entitled “Guyana’s very low production cost likely to yield big returns,” following on an earnings call for the fourth quarter of 2017. That Vice President (Jeff Woodbury), was responsible for “Investor Relations,” and was also Secretary of the ExxonMobil Corporation. In responding to a question about “the company’s investment in deepwater exploration against the cost,” he is quoted as claiming: “a market price of even US$40 per barrel would still yield significant returns given that the cost is very low … when you think about some of the deepwater areas that we’re in, Guyana is a great example” (my emphasis).
Further, in the same report, Stabroek News further quoted him as claiming: “we’re leveraging our global deepwater capabilities … we’re picking up additional exploration potential … we’ll have a clear path to profitability relative to our other investment opportunities in the portfolio.”
Straight from the “horse’s mouth,” the above declarations unmistakably set a high level of expectations for a “low cost-high returns profile” for Guyana’s oil and gas, once prices hold significantly above US$40 per barrel.
However, later in the same year (November 5, 2018) Stabroek News returned to the topic of questioning ExxonMobil on its production cost, in an Editorial. This time it reported: “Following a question by Stabroek News, ExxonMobil has, in a statement to the newspaper declared it will not disclose its estimated cost of production for oil to be extracted from the Liza 1 well in 2020” (my emphasis). Further, the Editorial quotes ExxonMobil as stating: “We typically don’t give that information but we work closely with the Government on estimated costs and production plans.” The Company also indicated that: “Upon start-up, we’ll have a small ramp-up period to full production [and] apart from periodic maintenance, we plan to operate at full capacity.”
In the absence of company data therefore, I shall have to resort to other indicators in order to identify an indicative unit cost range, which I shall apply for the purposes of cost calculations related to Guidepost 6.
Two Options
There are of course, two options; one is, the IOCs voluntarily publish their cost data. And, the other is for government to compel disclosure. I shall follow up on this and discuss the second option next week.
Pro forma template
A question that readers frequently raise with me is: what are the main items that typically make up the cost of a barrel of crude oil and gas. These items vary in presentations of this data. Schedule 1 shows a pro forma template of those costs that energy analysts apply. The Schedule indicates 10 items to illustrate cost determination. I shall briefly refer to the source of this template in next week’s column. These are:
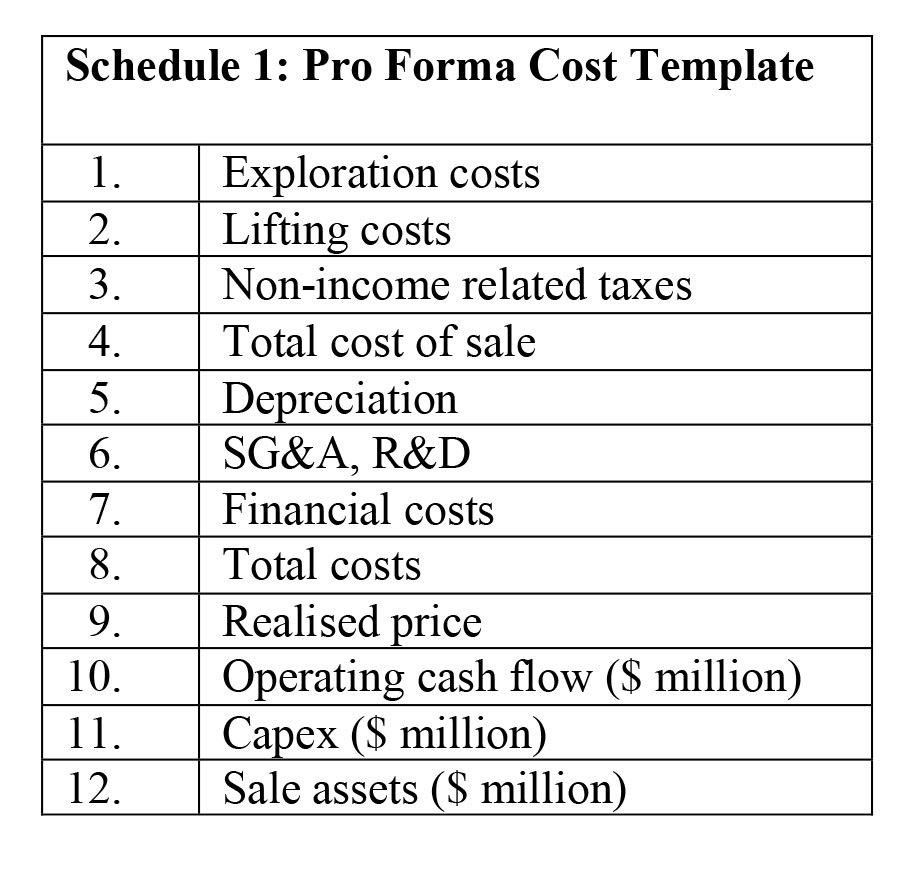
Item 1: Exploration costs constitute costs incurred in the search for oil and gas; that is, determining: the existence, location, type (quality) and therefore economic appraisal of finds. Such activities include research and exploratory well drilling. These are high risk costs as there is no guarantee of successful commercial finds. Item 2: Lifting costs constitute costs incurred after drilling is complete and are required to operate/maintain wells and related equipment/facilities, including transport and labour costs. Item 3: Non-income related taxes are taxes other than income taxes the IOCs pay; for example, VAT, sales taxes, royalties, rates and other real property taxes. Item 4: Total cost of sales is the sum of items 1 to 3. These are direct costs attributable to the production of oil and gas.
Item 5: Depreciation constitutes accounting for “acquisition, exploration and development of oil and gas reserves.” It indicates the allocation costs for material assets employed, over their useful life. Item 6: SG&A, that is, Selling, General & Administrative Expenses, are the total direct and indirect selling expenses, as well as all general and administrative expenses. As such, it includes the costs of selling, delivering and managing the IOC; R&D, meanwhile, constitutes expenditure on Research and Development. Item 7: Financial costs constitute the standard items: “cost, interest and other charges incurred from borrowing to purchase assets.” These expenses are incurred from securing finance. Item 8: Total costs are equal to items 4 to 7. Item 9: The realised price in the market per unit of oil and gas sold. Item 10: The operating cash flow is a key performance metric. Item 11: Capex is capital expenditure. And, finally, Item 12: The IOC’s sale of assets, if any, to finance capex.
Conclusion
Next week I take up from the above and zoom in on further data supporting my personal estimation of an indicative unit cost range application for the Road Map.