 Introduction
In last week’s column, I had introduced Hess Corporation’s oil assets portfolio as presented by its Chief Executive Officer (CEO) to the “Barclays Energy — Power Conference,” held in September, 2018. That portfolio characterises its Guyana holdings as “one of two high growth engines.” Further, the Guyana holdings’ cash costs are less than US$10 per barrel of oil equivalent (boe), and cash holdings had achieved a 20% compound annual growth! Additionally, exploration and development (E&D) cumulative capital allocation during 2018-2020 is projected for Guyana and the Bakken at 75% of the total capital allocation (the Bakken is Hess’ other high growth engine).
Hess’ portfolio estimates that its “lower growth cash engines” (Malaysia and the Gulf of Mexico) will generate about 70% of cash flows from operations through 2018-2020 as well as 20% of total capital expenditure (CAPEX) for the same period.
Today’s column zooms in on the cost aspects of the CEO’s presentation. This is because, as indicated, I am using the information provided as guidance for estimating an indicative unit cost range, to apply when forecasting Guyana’s petroleum revenues.
Hess’ Cost Metrics
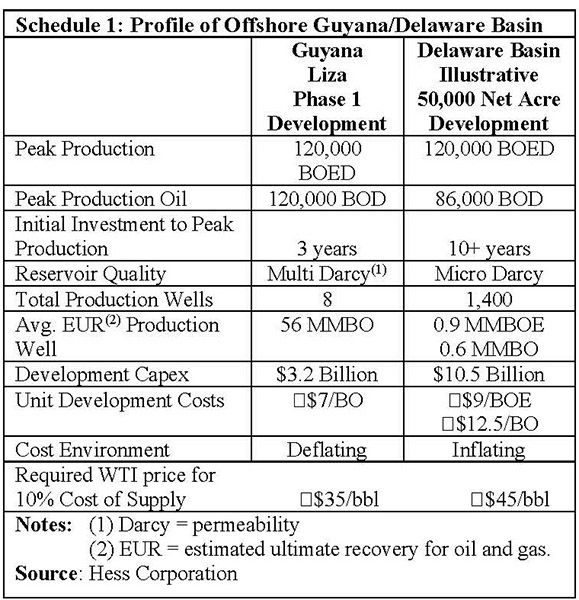
The CEO’s presentation provides several wide ranging PowerPoint tables, covering the entire portfolio. All tables speak either directly or indirectly to Guyana’s unit cost of crude oil. Examples of the indirect PowerPoint tables include: 1) Step change reduction in unit costs; 2) Generating cash flows (outpace) production growth; and 3) Portfolio delivers significant free cash flows. While tables like these are significant, they are considered indirect because they offer composite data across the entire portfolio. However, there are Guyana-specific tables; these I consider direct. These direct tables focus on the Liza finds (Phases 1 to 3). And, perhaps the most directly useful for my purpose is PowerPoint (12), which is titled Offshore Guyana, and sub-titled Liza Phase 1 (Low development costs and outstanding financial returns). The information in that Table is reproduced in full in Schedule 1.
The Schedule compares/contrasts Guyana’s situation with information on the Delaware Basin. However, let us start with the information on the Guyana Section of the Schedule; listed in the first column. First, the Schedule presents data on Liza 1. Peak production for both oil and oil equivalent is estimated at 120,000 barrels per day. Second, it takes three years to shift from start-up production to full ramp-up. Third, the reservoir quality (or permeability) is given as Multi Darcy, based on its standard measure. Fourth, Liza Phase 1 has a total of eight production wells. Therefore, on average, the expected ultimate recovery, EUR, from each well is 56 million barrels of oil. This requires Liza Phase 1 to have 8 wells each producing approximately 450 million barrels of oil (MMBO) from the reservoir. Development capital expenditure (CAPEX) for this project is cited at US$3.2 billion; thereby yielding a unit development cost of US$7 per barrel of oil.
Finally, Hess describes the cost environment of its Guyana operations as “deflating.”
Based on the above data, Hess makes the observation that, in order to achieve a 10% margin, the required WTI price of oil is US$35 per barrel! This is excellent.
Further evidence of how good these results are, is revealed when they are compared/contrasted to similar data for the Delaware Basin investments. There are several striking differences. Thus: 1) The wide difference in a barrel of oil equivalent (boe) and a barrel of oil in the Delaware Basin area; 2) The Delaware Basin takes more than thrice as long as Guyana to ramp-up to the same boe (120,000). That is 10+ years as compared to 3 years; 3) There are 175 times the number of operating wells in the Delaware Basin compared to Guyana offshore! 4) Consequently each Delaware well’s output produces far less than each Guyana well; 5) Finally, the development cost for the same BOED is thrice as large in the Delaware Basin as Offshore Guyana!
Unit development cost in the Delaware Basin is higher than Offshore Guyana. Specifically, the Schedule reveals that the Delaware Basin’s unit cost is about 78% higher than Guyana offshore! Consequently, the required WTI price for a 10% margin on cost of supply is US$45 per barrel, as against just US$35 per barrel for Offshore Guyana.
The conclusion arrived at by Hess Corporation CEO is accurate: “Liza Phase 1 offers breakevens superior to premier US shale plays.” From this standpoint, Guyana’s offshore is a “truly transformational investment opportunity for Hess.”
Also of great significance for present purposes is the fact that the Hess CEO cites a study, which I had earlier referenced. This is the RS Energy Group’s, analysis of 50 top global offshore developments and shale plays. The analysis found Liza breakeven is the lowest!
Recently (April 18, 2019), Hess Corporation announced a new Guyana offshore discovery; Yellowtail -1 is the 13th on the Stabroek Block. The fifth in the Turbot area. Hess claims the discovery strengthens the creation of another major crude petroleum development hub and reasserts its earlier statement that: “development activity continues at other locations.” Indeed the Corporation goes on to repeat another earlier claim “of achieving 500,000 barrels per day (bpd) through 2023 en route to 750,000 bpd by 2025 with the use of up to five Floating Production, Storage and Offloading (FPSO) Liza Phase 2,” subject to Government approval. Hess continues to hold a 30% interest and have faith in the ExxonMobil and partners consortium.
Conclusion
Next week, I start with the University of Trinidad and Tobago’s petroleum engineering department model evaluation of Liza 1. This is the second study providing significant guidance, for my depiction of an expected indicative unit cost range for Guyana’s expected petroleum output.