Introduction
Today’s column evaluates the University of Trinidad & Tobago’s (U of T&T) modelling of the Liza Field Development. Next to Hess Corporation’s cost metrics that I introduced last week, this Conference Presentation has had the second most impactful influence on my choice of an indicative unit cost range for assessing Guyana’s expected petroleum revenues. The Hess Corporation’s Conference Paper (considered last week), is the most influential because ultimately it has wider coverage and is sourced from a senior partner of ExxonMobil and partners.
The U of T&T Paper was presented to the Society of Petroleum Engineers, Trinidad and Tobago Section, Energy Resources Conference, 2018. This Conference was themed Forging Ahead: Changes, Challenges & Opportunities. The Authors are K. Alleyne, L. Layne and M. Sourosh, all affiliated to the U of T&T.
Model: Key Features
As the Authors declare their “representative model was created using the following software: Petrel, Wellplot Digitizer, PROSPER, CMG and Microsoft Excel” (my emphasis). Petrel is a Windows PC software that “aggregates oil reservoir data from multiple sources”. Wellplot Digitizer is a web-based tool designed “to extract data from plots, images and maps”. PROSPER is used to model well bores.
The Paper models the main features of ExxonMobil’s Liza Development Plan, with which readers are familiar, given how often this has been previously discussed in this series. Briefly, the Plan constitutes 1) eight producing wells 2) three gas injectors and 3) six water injectors. Operations are based on a Floating Production Storage and Offloading (FPSO) vessel. The Authors simulate results over a 25 year period, in which 456 million stock tank barrels of oil (MMSTB) and 3.5 trillion cubic feet (TCF) of gas are produced. The combined total is equivalent to 1.04 billion barrels of oil equivalent (boe).
Key elements of the Government of Guyana (GoG) and ExxonMobil and partners Production Sharing Agreement (PSA) are built into the model for two purposes 1) an economic assessment and 2) quantification of government’s share of revenue (or Government Take), from the Liza Phase 1 Development.
The variables the Authors list in the Paper are: 1) capital expenditure (CAPEX), of US$4.5 billion (this has since been re-assessed downwards by the Contractor to US$3.7 billion) 2) an oil price of US$50/barrel and gas price of US$2.50/MMBTU 3) a payback period “within six years of commencement of production” and 4) the PSA’s several “fiscal arrangements”, including royalty payment, cost recovery mechanism and profit oil split.
Methodology
As indicated, the Conference Paper is constructed around three major areas of engineering and economic/financial research and modelling. First, research into the Atlantic mirror image theory and related transform margins (this has been already discussed extensively in this series). Second, case studies on other similar areas and regions. Third, public reports on Liza Phase 1 from a variety of sources, including ExxonMobil and partners as well as data obtained from specialist firms like Wood-MacKenzie Ltd.
The Authors admit upfront, their study clearly has important limitations. These stem from the use of unofficial data, along with their reliance on modelling a reality of oil and gas production that has not yet commercially arrived! It should be stressed here that, not a single unit, of either oil or gas has been commercially produced to date. Consequently, too much reliance is placed on research from “similar field situations”. The Authors frankly admit: “with no maps, logs or reservoir data; geostatistical and engineering concepts were used to compensate for lack of data”. The Authors therefore, rightly, recommended that uncertainty assessment should be implemented for any future simulations!
I have considered many of these issues in my earlier rather extensive review of the Open Oil application of the FAST model to Liza Phase 1. This will be revisited in next week’s column. However, for convenience I refer readers to my columns for the period March 6, 2018 to June 24, 2018, which dealt with this topic extensively.
Static & Dynamic Modelling
The Authors employ both static and dynamic modelling. The static model was developed using the software mentioned above (Petrel, Wellplot Digitizer and Microsoft Excel). The paper offers details on the results for oil producers and oil injectors. Interested readers can examine these. The dynamic modelling simulation, as the paper indicates, was undertaken using the Computer Modelling Group Ltd, (CMG) software. Details of the parameters employed are presented in the paper and again, interested readers can retrieve this from the Paper.
Economic Results
As indicated earlier, the Conference Paper analyzes briefly the economics of Liza Phase 1, based on the PSA (elements of which are summarized above: royalty, cost oil/gas, profit/gas, profit oil split (and income tax)). Three oil prices are used 45, 50 and 65 US dollars. The key results are summarized in Schedule 1.
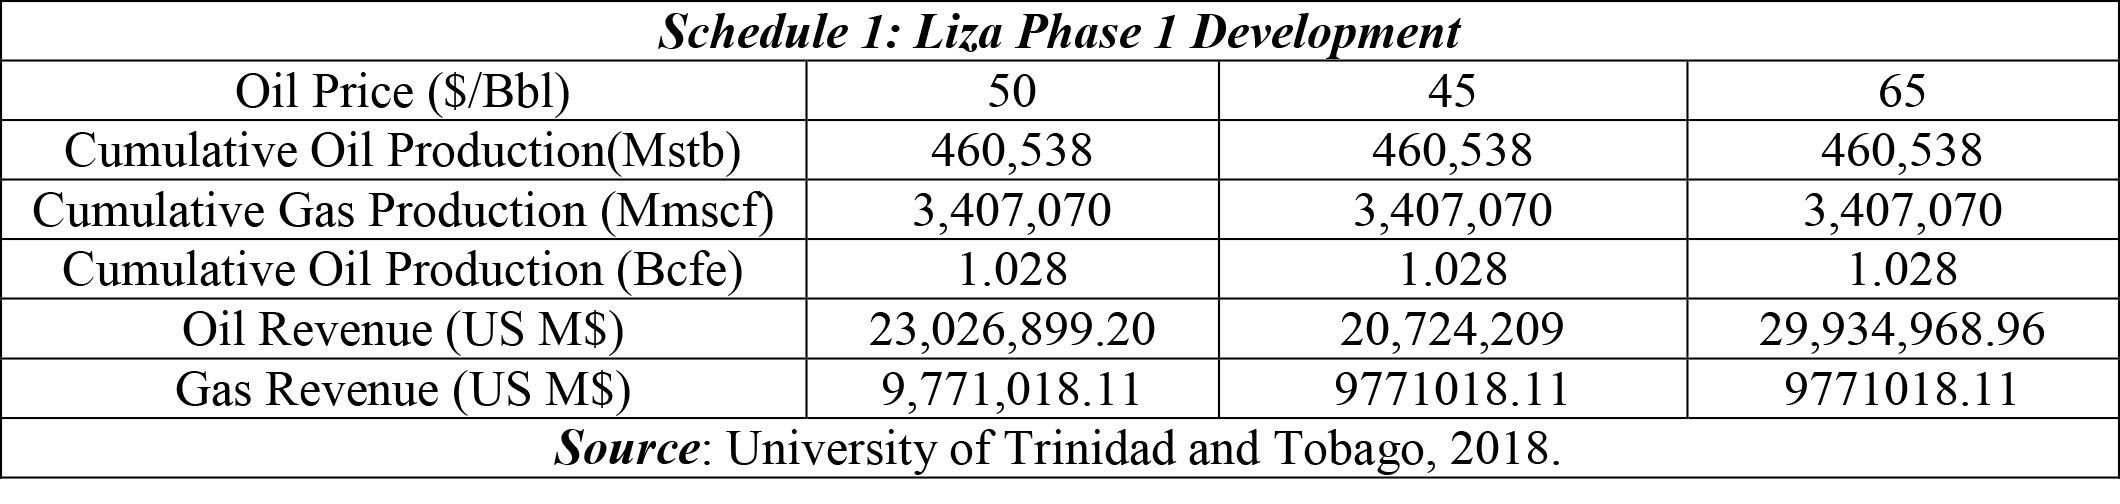
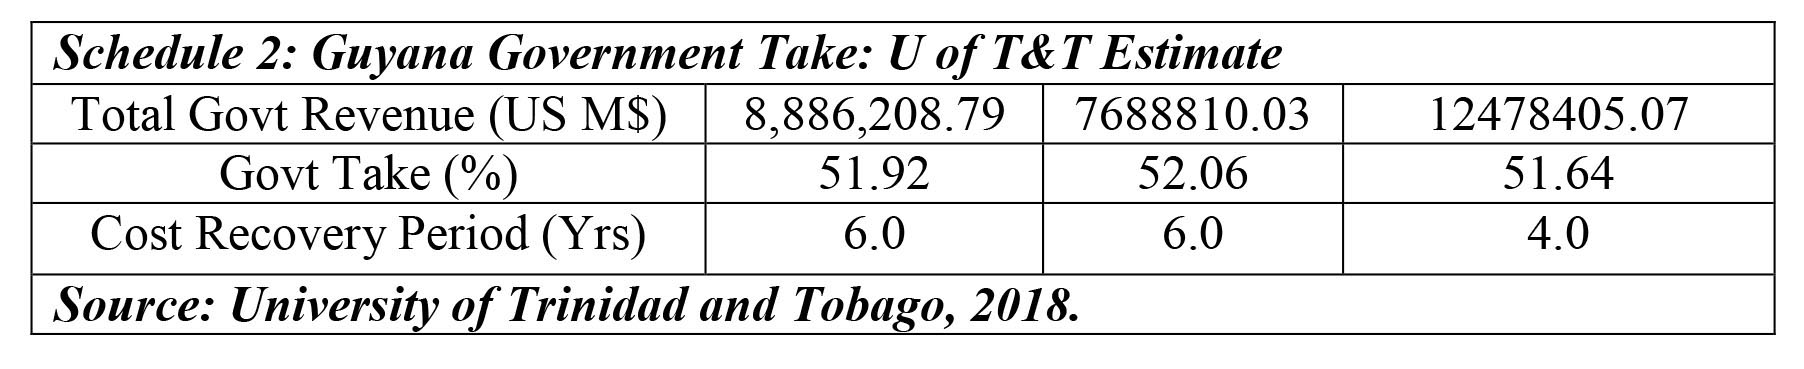
The Authors’ conclusion is summarized as follows. “Based on ExxonMobil estimated capital investment of US$4.5 billion (note revised downwards), an oil price of US$50/bbl, gas price of US$2.50/MMBTU, projected operational expenses over the twenty five period, total new revenue to Guyana over this period will amount to US$8.9 billion.” It is also estimated that Guyana’s share of the development cost will be paid back within six (6) years after commencement of production in the Liza field.
Conclusion
These economic results indicate strong profits for a relatively low average price ($US53 per barrel). This suggests a highly competitive unit cost. This is good news and complements Hess’ observations stated last week “this cuts by half drilling and time costs”. Further, Offshore Guyana reservoirs have “exceptional well quality and low development costs when compared to other deepwater wells in the Gulf of Mexico”.
The model averages Government Take at 52 percent; identical to the Road Map’s choice of Government Take!