Introduction
For the purposes of Guidepost 6 as listed in my presentation of Guyana’s Petroleum Road Map for its dimension of “assessing expected petroleum revenues”, I have already considered Hess Corporation’s cost metrics. Those metrics were retrieved from Hess’ September 2018, Barclays Conference Paper on “Power–Energy”. The subsequent week, I evaluated K. Alleyne’s et al cost metrics in their presentation to the Society of Petroleum Engineers Conference, Trinidad and Tobago Section, 2018, entitled: Liza Field Development – The Guyanese Perspective.
Today’s column considers a third set of cost metrics for Guyana’s oil and gas. These are from the Open Oil FAST modelling of Liza Phase 1. I had engaged this model extensively a year ago, in columns during the period March 6 to June 24, 2018. At this stage my prime intent is to highlight the cost metrics of this modelling exercise.
Like K. Alleyne’s presentation (considered last week), Open Oil’s modelling focuses on the Liza Phase 1 Development. This modelling exercise is also not supported by official data; relying on ExxonMobil and partners’ sanctioned public releases.
The cost metrics in the K. Alleyne’s et al (U of Trinidad & Tobago (T&T) Presentation) revolve around the usual variables: crude oil and gas prices, capital expenditure (CAPEX), operational expenditure (OPEX), estimated volumes (barrel of oil equivalent (boe)), value of sales, and, net cash flow (Government Take and private profit).
Open Oil FAST Model
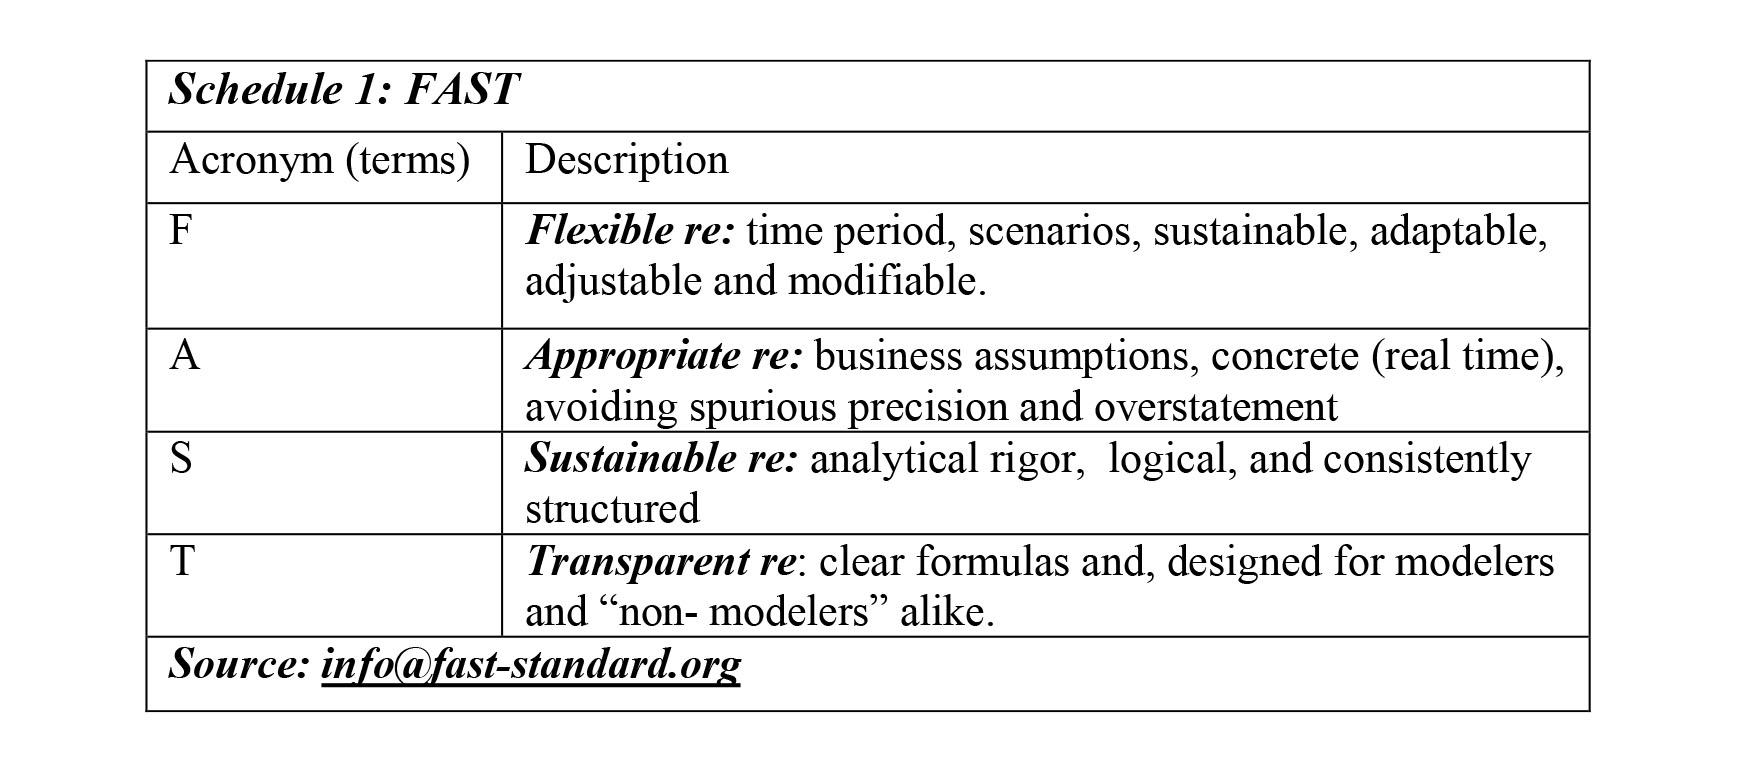
Open Oil’s FAST Modelling Standard was employed to evaluate Liza Phase 1. The acronym FAST is described in Schedule 1. FAST emphasizes the flexibility, appropriateness, sustainability and transparent features, which are built into this model, designed for use in the hydrocarbons sector.
The models (K. Alleyne et al and Open Oil), differ in important features. First, Open Oil models the Liza Field life over two decades (20 years), while the U of T&T model utilizes a two and one half decades field life (25 years). Secondly, the U of T&T’s model utilizes three separate boe prices; namely, US$45, US$50 and US$65, while the Open Oil Model uses a base price, but provides a user option for varying prices.
The FAST model’s base price is the Energy Information Administration (EIA) Reference Price to 2050, as of February, 2018. As indicated, this parameter can be changed as required by users of the model.
Thirdly, the Open Oil FAST Model specifies a production profile. However, total production (450 million barrels) is roughly equivalent to the 456 million boe employed in the U of T&T model. Fourthly, the Open Oil FAST Model explicitly accommodates for changes in “reserves growth”. Finally, Open Oil’s schematic production profile allows for 1) one-year ramp-up to full production in the mid-2020s 2) a six (6) year plateau phase and 3) a 12.5 percent annual decline to cease production.
The Open Oil FAST Model depicts projected cost items quite clearly. These are revealed in Columns 1 and 2 of Schedule 2.
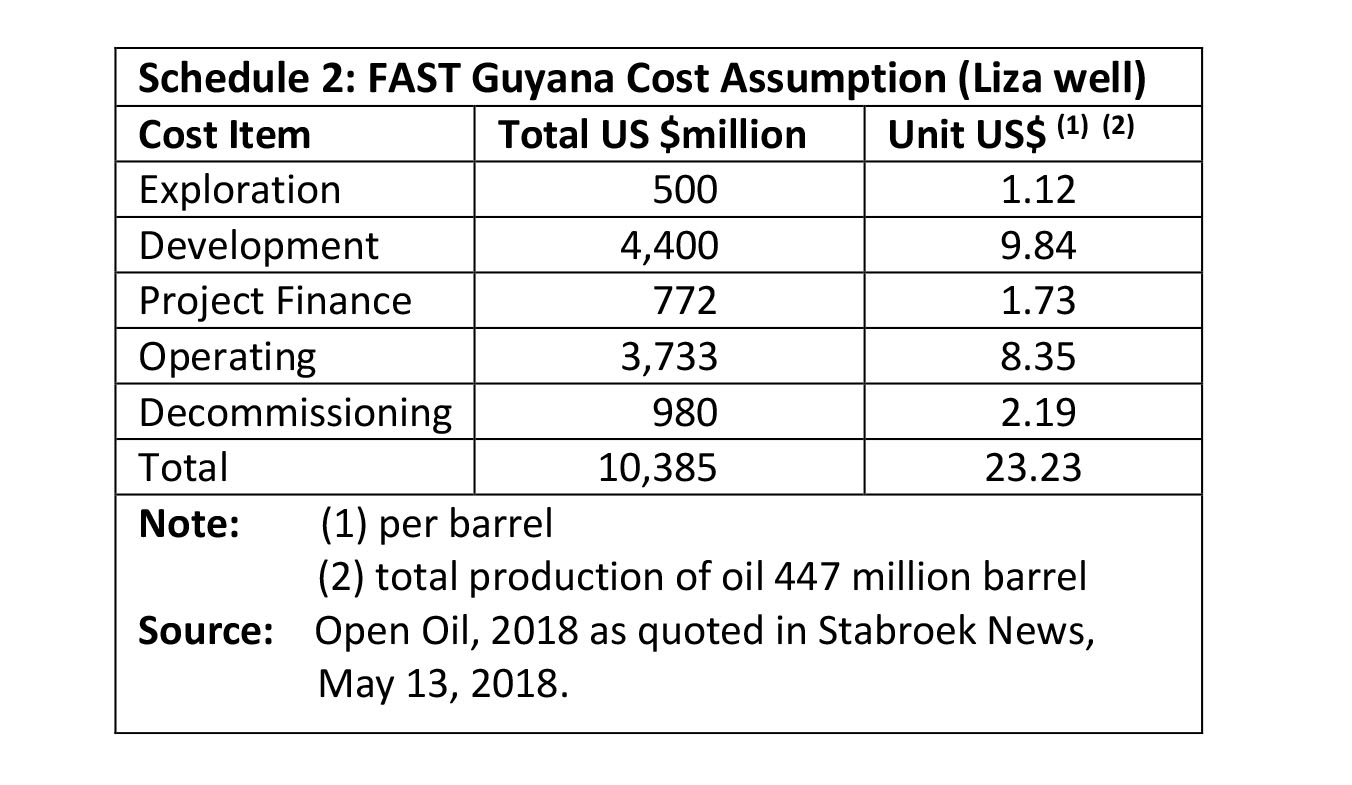
Six items of cost are revealed in Column 1. Exploration Cost is assumed at US$500 million “given the size and location of work, and scale reported in media outlets” Development Costs for this stage (US$4.4 billion) “are taken from public statements by ExxonMobil “. Readers should note that, Hess has since reported this figure (US$4.4 billion) has been revised downwards by US$700 million to US$3.7 billion. De-commissioning Costs are estimated at 20 percent of development cost. This is therefore US$930 million.
Project finance is estimated at US$772 million. Significantly, operating costs combine a fixed and variable component. The fixed component is estimated at US$51 million per year; and the variable component is US$6 per barrel of oil. This gives a total operating cost of about US$3.7 billion. Therefore, the combined overall total costs is US$10.4 billion.
In Column 3 of Schedule 2 I have calculated the unit cost, per barrel of oil based on the model’s use of a total production of 447 million barrels.
The overall unit cost is US$23.23 per barrel of oil. The most expensive items are development cost per barrel of oil US$9.84 and operating cost of US$8.35. Other per barrel costs range from a low of US$1.12 per barrel of oil (exploration) to decommissioning cost (US$2.19 per barrel).
Fiscal elements
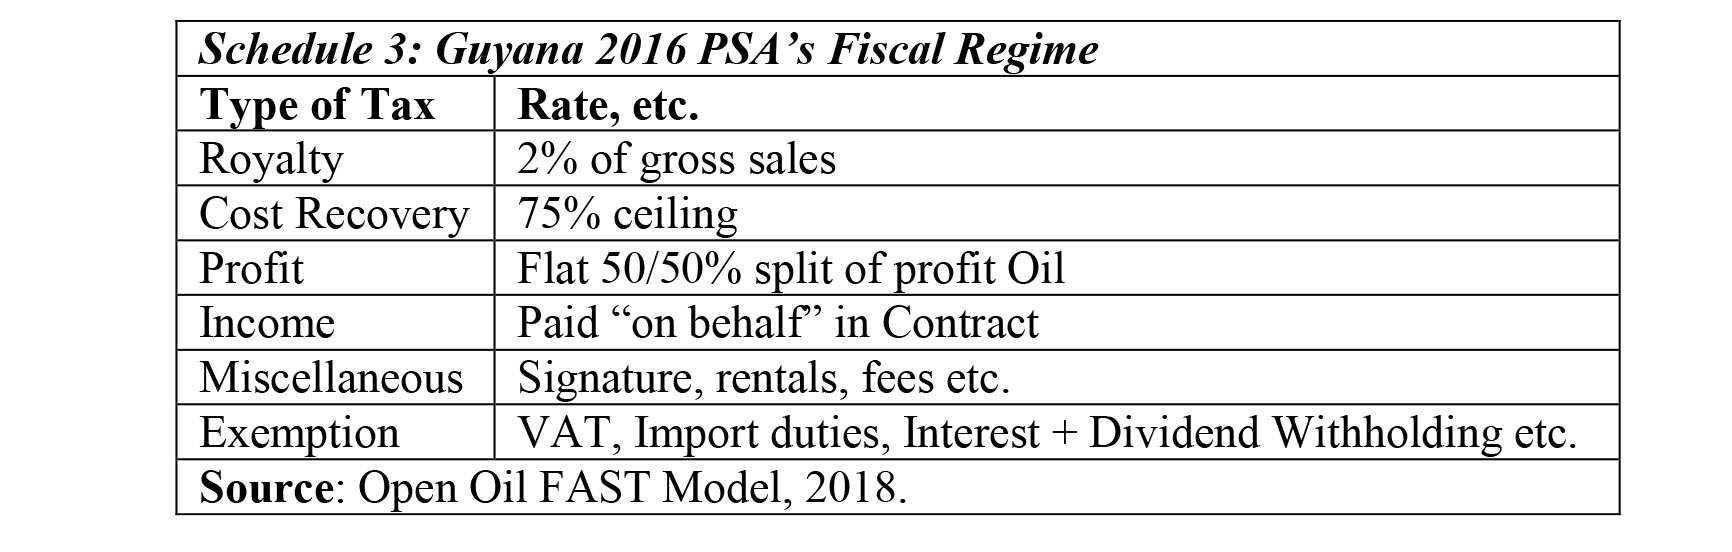
The Open Oil FAST Modelling Standard embraces the familiar six core elements of the Production Sharing Agreement, PSA. These are 1) the royalty placed on gross sales (two percent) 2) cost recovery (with a ceiling of 75 percent) 3) profit petroleum (based on 50/50 percent split) 4) income tax (which is paid out of Government’s profit of 50 percent, on behalf of Exxon and partners) 5) miscellaneous (which includes the one-off signature bonus, rentals, fees etc.) and finally 6) a range of exemptions, including, VAT, Import duties, Interest and Dividends, Withholding Tax. These are displayed in Schedule 3 just as it is in the report on the financial modelling exercise. The Liza field life is 20 Years.
These data are reproduced for convenience in Schedule 3.
Conclusion
Next week I plan to wrap-up my discussion of Open Oil’s Model and Guidepost 6. I shall also refer to the broader material that has impacted my depiction of the indicative unit cost range I shall apply for estimating Guyana’s projected Government Take from its petroleum revenues.