Introduction
Last week’s column wrapped-up my discussion of break-even prices, both from a business (commercial) perspective and a fiscal and their relation to the unit total cost of Guyana’s crude oil exports. Both break-even prices are determined, bearing unit total cost in mind. However, for the private business calculation of the break-even price, which is market based, this relation is of utmost stringency. For the fiscal break-even price, stringency is there, but far less This is the case because normative considerations dominate because this price is based on what the National Budget determined price the Government thinks “ought to” prevail.
Indeed, it is also for such reasons why, as a rule, the fiscal break-even price substantially exceeds its business (commercial) counterpart.
This week’s column focusses however, on wrapping-up the discussion of Guidepost 6 in Guyana’s Road Petroleum Road Map for its first dimension of “getting petroleum revenues.” Moreover, the column also provides the “indicative unit cost range per barrel of oil equivalent, boe,” that will be used in my projections of Guyana’s likely petroleum revenues, after cost. Next week, in the final column of this dimension, I shall provide a broad summing-up of the major indicators of this dimension before I turn to address the second dimension of the Road Map, namely “spending the petroleum revenues.”
Guidepost 6: Unit cost boe
Thus far I have sought to establish the pivotal importance of the following relation; that is, the metric, which I believe best reflects Guyana’s “getting petroleum revenues” rests in the unique relation between the unit cost per boe and the price per boe obtained for sales of Guyana’s petroleum products. The applicable unit price was introduced and indicated in my earlier discussion at Guidepost 3. The expected quantities to be sold were also introduced and discussed at Guidepost 2. Both metrics will be briefly re-capped in next week’s column.
The reasoning behind the relation I have identified above is based on standard economics. Simply put, this indicates that the rate of profit on Guyana’s crude oil production and sale is a function of the value difference, between its average (unit) total cost of production and the average realised price from all its sales. Consequently, total net petroleum revenues or profit in any period is a function of this difference (expressed as a rate) times the volume of sales.
Experience has made it quite clear that accurate prediction of the unit total cost of production and sale for complex businesses is exceedingly difficult to achieve, particularly in the absence of appropriate cooperation from those firms. This certainly holds true for the complex crude oil exporting firms that are leading Guyana’s approach to First Oil. Indeed, one can further posit that such difficulty is compounded when First Oil is not yet achieved, and therefore proxy data are not yet available. Readers should be reminded here that, I had stressed as well complications posed by the life cycle of the worked oil fields and their expected pay back periods. These are similarly crucial for the accurate calculation of the unit total cost of crude oil production and sale.
Bearing the above in mind, readers would recall that, I have identified earlier the following unit cost per boe indicators:
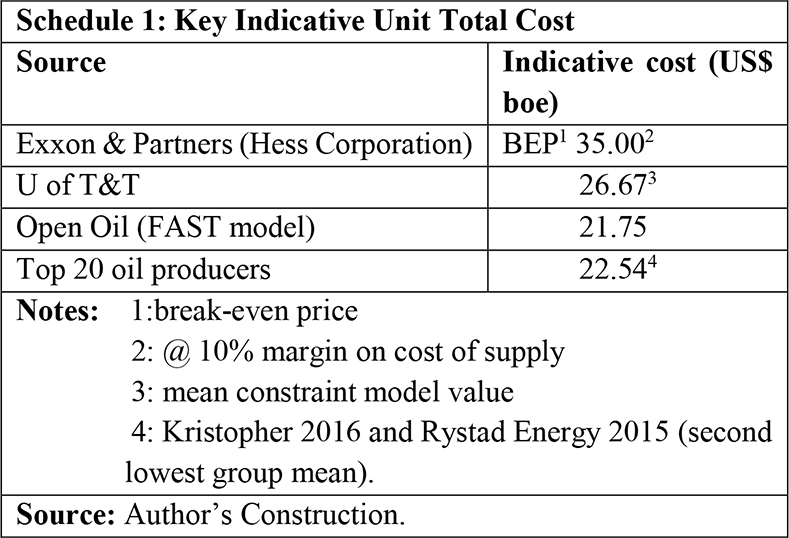
ExxonMobil and partners — Hess Corporation’s identification of US$35 per boe as yielding a 10% margin on cost of supply!
Their supportive reference to RS Energy Group’s analysis of the top 50 offshore and shale plays. To cite the Group’s report: it “ranked the Liza development with the lowest break-even price.”
As indicated earlier ExxonMobil and partners had publicly claimed that “Guyana’s very low production cost [is] likely to yield big returns.” Subsequently they have since declined to disclose their estimated cost of production of Guyana’s crude oil by claiming “we typically don’t give that data.”
University of Trinidad and Tobago (U of T&T) modelling of the Liza development had yielded Government Take averaging approximately 52% at prices of 45, 50 and 65 US dollars per boe, respectively, when the model constrains unit costs at 22.50, 25.00 and 32.50, respectively. The mean of these constrained costs is US$26.67 per boe.
Open Oil, FAST Model yielded per unit cost of US$23.25 per boe for Liza development. The internal rate of return (IRR) on the Liza development is 19.6 percent for a price of US$65 per boe. The IRR has high elasticity in relation to quantity of output (size of oil field). Since that publication published data through Hess Corporation reveal a decline in total exploration cost of US$0.7 billion, thereby reducing the average cost by about US$1.50 to US$21.75
Top 20 Oil Producers. If this category of crude oil producers is broken into four separate sets of rankings, from lowest to highest unit cost as was indicated earlier, these unit costs (boe) range in values from a low of US$10.80 to a maximum of US$42.92.
For convenience these data are summarised in Schedule 1 at right:
Decision
Given the information above, there remains so many uncertainties, as well as known unknowns and unknown unknowns, which are attached to likely crude oil costs in Guyana that it would be rather reckless to indicate more than a broad range of values for per barrel of oil equivalent going forward, at a point in time when production has not started. And indeed such an indicated range is by definition little better than an informed guesstimate. For what it’s worth, therefore, I shall use the range of US$21.75 to US$31.50. The lower estimate is based on the Open Oil FAST model; and the higher estimate is based on Hess Corporation’s break-even price less 10%.
Conclusion
Next week I recap Part 1 of the Road Map to conclude discussion of it.