Introduction
Last week’s column offered a brief overview of Part 2 of Guyana’s Petroleum Road Map. Part 2 covers the spending dimension of the Road Map and its five specific Guideposts. It also offered an introductory snapshot for each of the five Guideposts. Today’s and next week’s column will provide a discussion of the first Guidepost. This will centre on the estimation of a likely ratio for Government Take and petroleum revenue yield at and around the time when petroleum extraction is at full ramp-up. The other four Guideposts are presented thereafter in sequence.
Treatment of Government Take
As was indicated earlier in the series of columns on Government Take, I treat this as being at its core a simple function of the relevant fiscal rules for a given petroleum contract between Government (as resource Owner) and the private company/companies as the exploration and development (E&P) Contractor. For purposes of the Road Map I intend to assume for this analysis that the Government of Guyana (GoG) and ExxonMobil (and partners) Production Sharing Agreement (PSA) is representative of all Guyana’s petroleum contracts going forward.
Having stated that, I hasten to confirm that I do expect going forward that the fiscal rules of the present PSA to evolve and, consequently, the Government Take ratio to rise. This will occur as experience suggest all petroleum contracts have proven to be dynamic, if risk and uncertainty decline. As offshore deep-water and ultra-deep-water technology and experiences grow this will reduce E&P risk and uncertainty. Guyana can expect therefore it will then no longer be treated as a high risk petroleum frontier country. Despite the sanguine outlook expressed here, I shall err on the conservative side and make absolutely no allowance in my discussion of Guidepost 1 of Part 2 for any future incremental gains in the Guyana Government Take ratio.
Recall at this point, in energy economics, Government Take is measured as an accounting or financial ratio (that is a “fiscal metric”). Indeed, Government’s petroleum revenues constitute a share of various petroleum projects’ net cash flow. Therefore, from an economic perspective this fiscal metric is a gross measure. It does not constitute a net benefit arrived at after taking into account government contingent’s liabilities for petroleum production (for example environmental, social and similar costs). Some of these analytical or conceptual concerns will be addressed next week as they have grave bearing on this analysis.
Measurement of Government Take
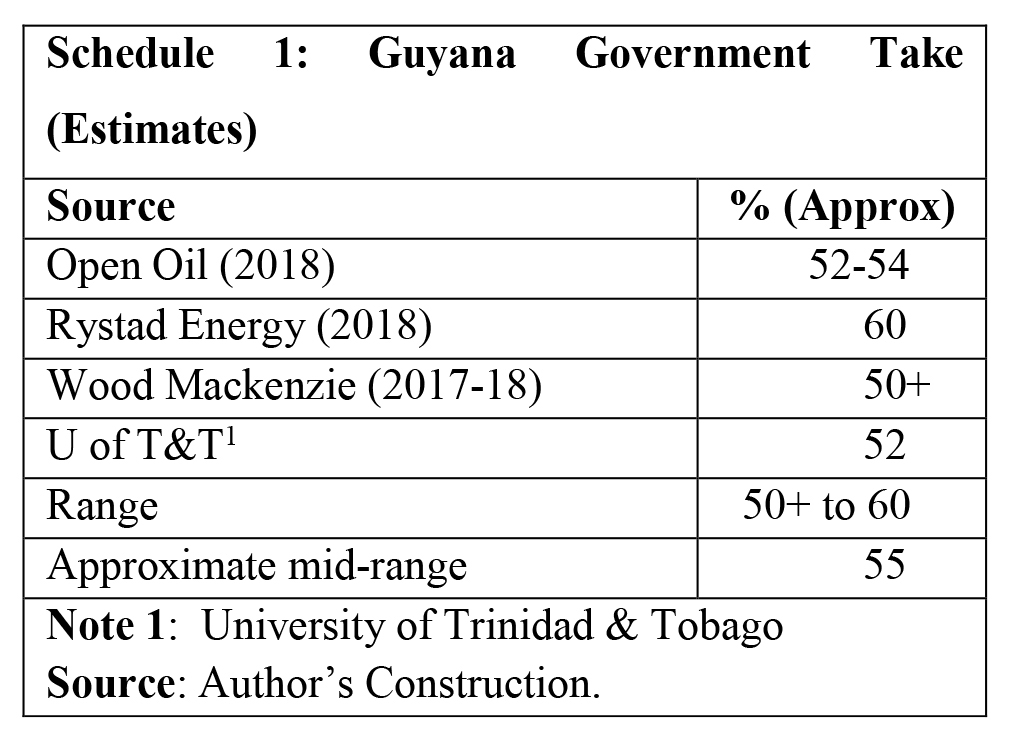
In earlier Road Map columns, I had drawn attention to the fact that I am aware of, and had published four available estimates of anticipated Guyana Government Take (namely Open Oil’s, Wood Mackenzie’s, University of Trinidad & Tobago’s and Rystad Energy’s). I reproduce these estimates in Schedule 1 below. I had also indicated previously that I would use the mid-point of the range in these estimates as my best predictor for this metric in Guyana. This value is 55%. Further, I still maintain this earlier prediction.
Fortunately, as matters presently stand, the Rystad Energy’s estimate of 60% displayed in the table has been accompanied by the firm’s projections of anticipated petroleum revenues, costs and profits based on the firm’s expected Guyana daily rate of oil production (DROP) of 600,000 barrels of oil equivalent (boe). Rystad Energy has been quite forceful in stressing its opinion that, while “Guyana’s fiscal regime is favorable to oil companies when compared to mature oil and gas development countries… it is in line when compared with other countries of equivalent maturity” Indeed Rystad Energy has directly taken on the IMF, which had publicly charged that the ExxonMobil PSA was “overly favorable” and had urged the Government of Guyana (GoG) “to rewrite its tax law.”
Rystad Energy stated its model prediction for Guyana’s DROP of 600,000, or 0.6 million boe. This could generate for Guyana an annual revenue of US$15 billion. Total costs are projected at about US$5 billion and consequently profit around US$10 billion. This profit amount is available for split between the oil companies and Government. The Government Take ratio means “this will give the government 60% from the various projects and the remaining 40% will go to the international E&P companies.”
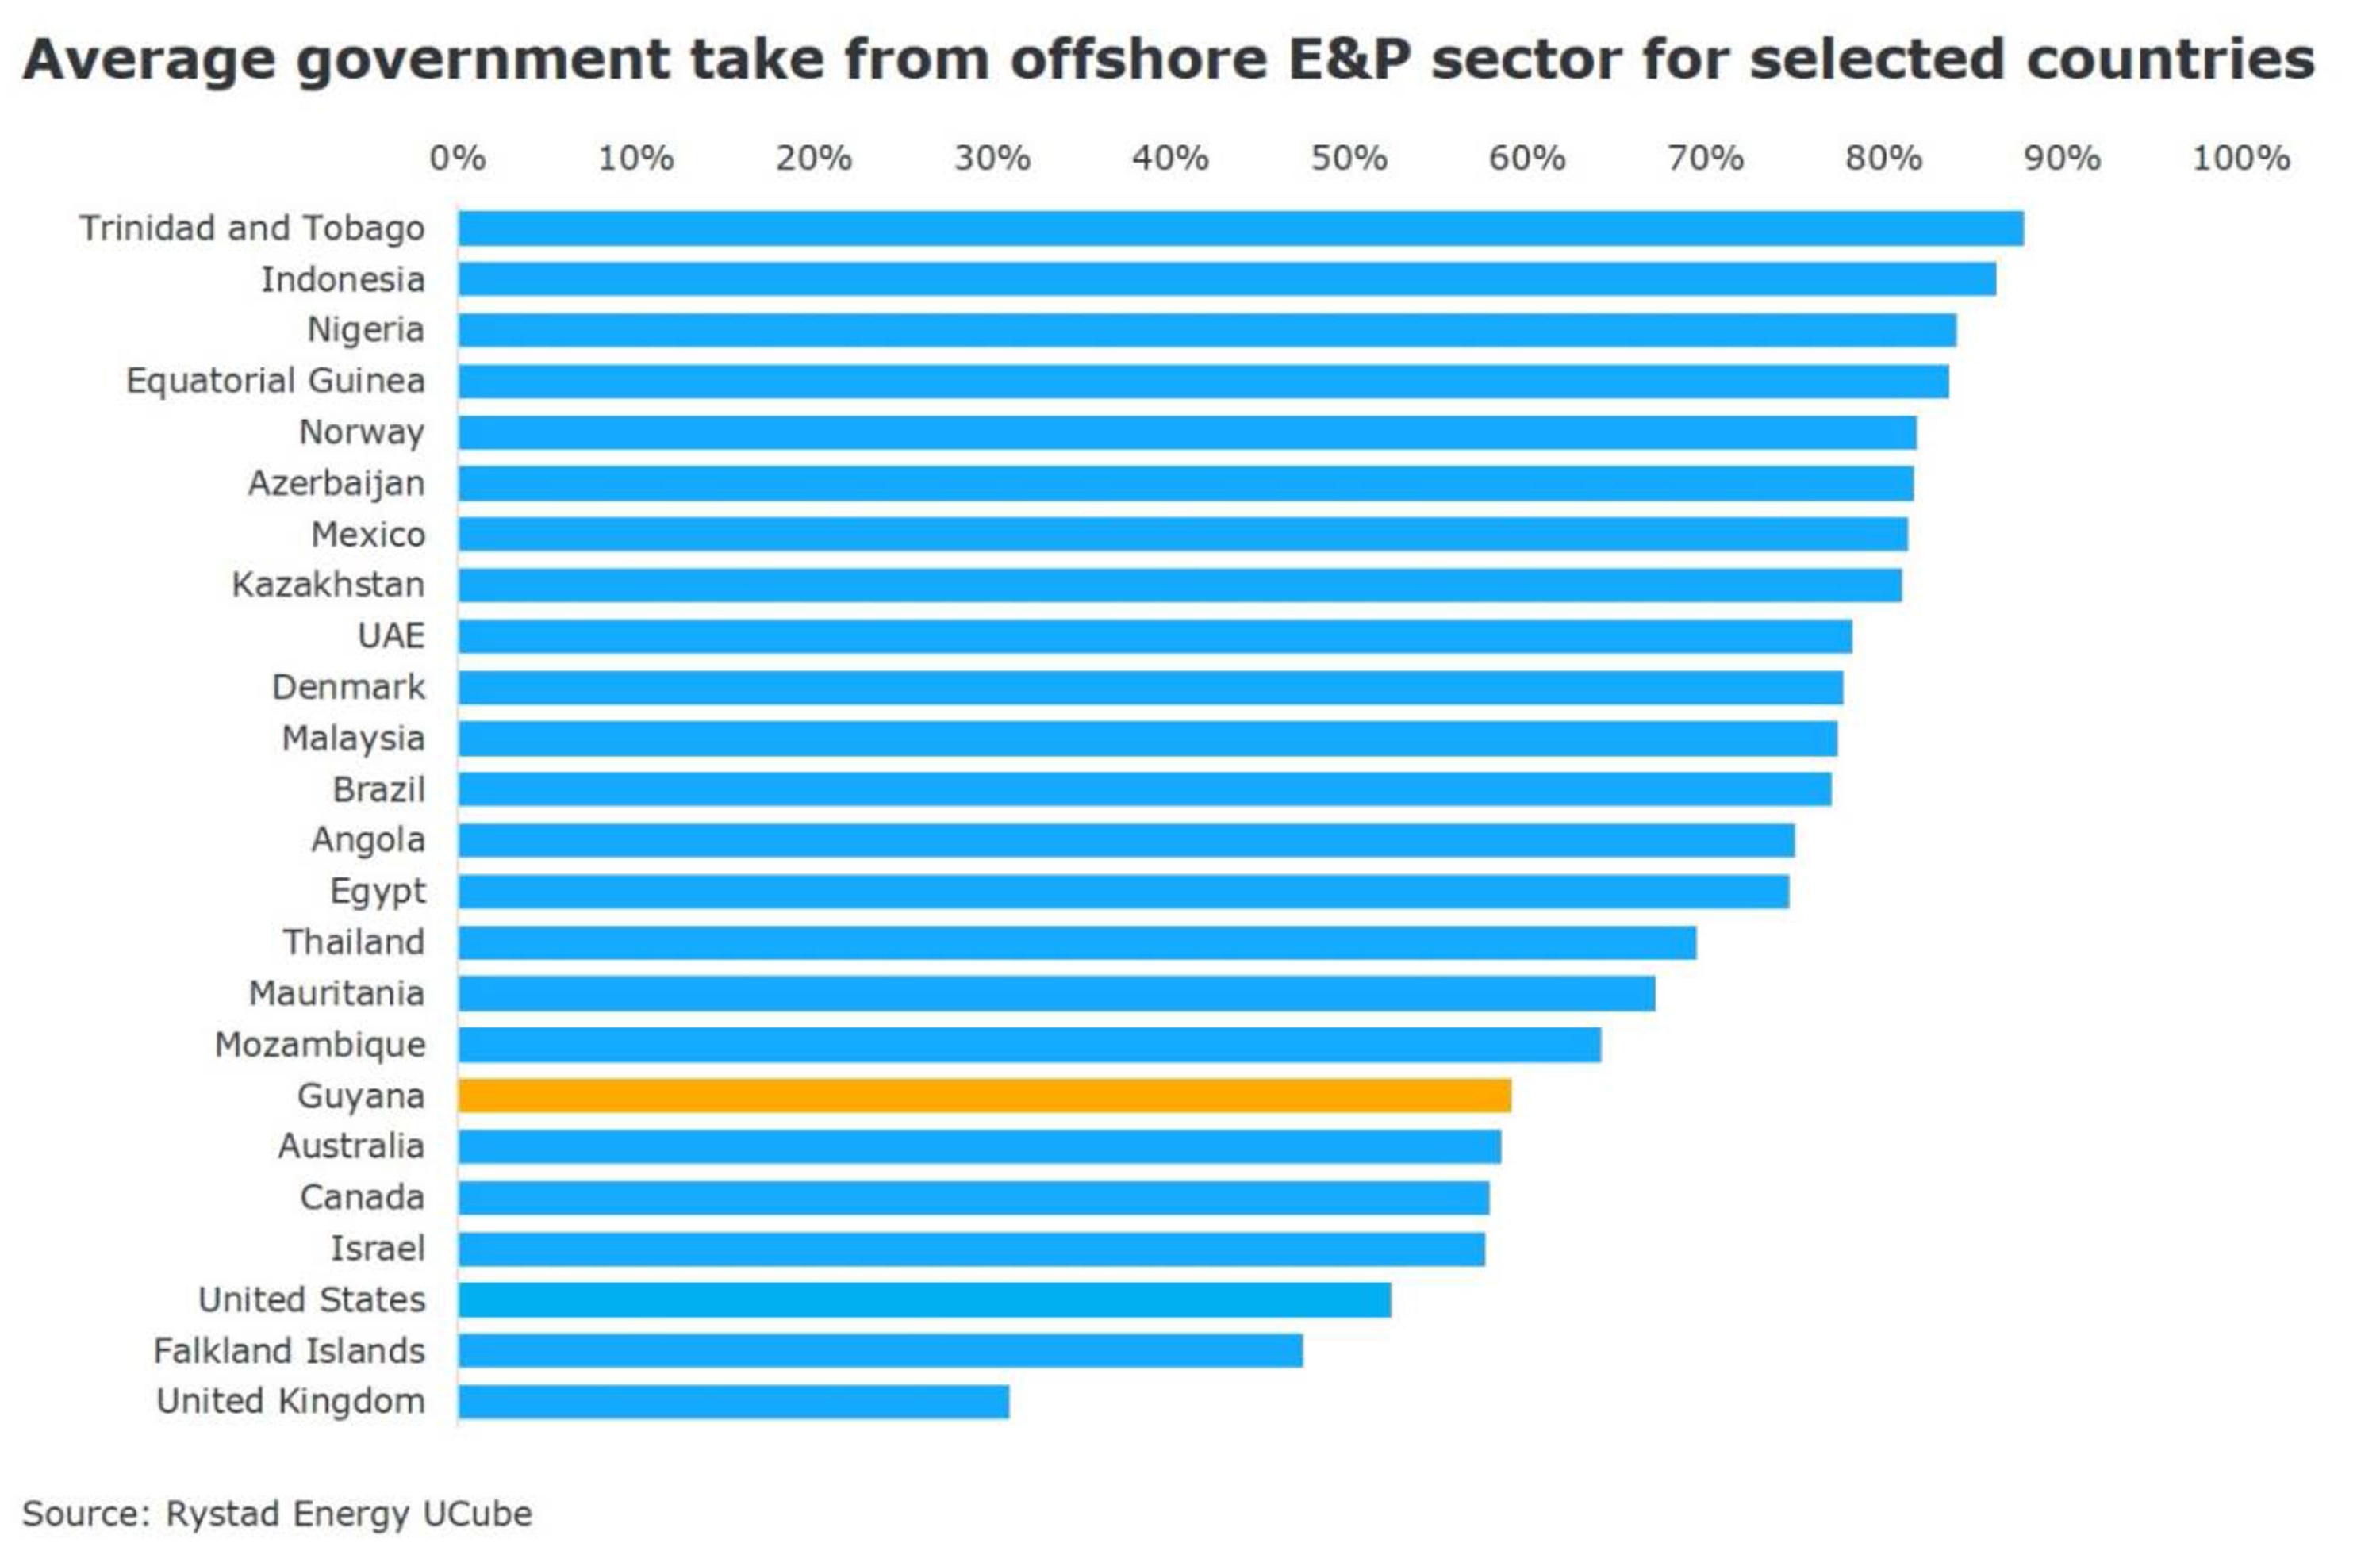
Schedule 2 below displays Rystad Energy’s calculations of average effective Government Take for 25 selected countries including Guyana. Guyana is one of seven countries whose annual average Take is 60% or less. However, of note, these seven countries include Australia, Canada, Israel, the United States and the United Kingdom! The data in the table range from less than 40% to well over 80%. Interestingly, Trinidad and Tobago has the highest Government Take for this selected group of countries.
A DROP of 0.6 million boe yields an annual output of about 200 million boe after allowance for routine maintenance and other stoppages. If this output generates US$15 billion in revenue, the average price per boe is then US$75. A profit of US$10 billion after all costs are paid makes total cost US$5 billion or the equivalent of one –third (0.33) of revenue or price obtained going to cover all costs. Further a 60: 40 split for government and oil companies gives the government US$6 billion and the oil companies the remainder of US$4 billion.
If the DROP varies, consequential calculations follow. Rystad Energy made its DROP prediction more than a year ago. Since then, announced discoveries of E&P firms have grown exponentially. Thus, if the expected DROP doubles to 1.2 million boe per day, all the other calculations of revenue, cost, profit, profit split also double in value!
Conclusion
Next week I’ll apply, for readers’ benefit, the DROP values, price and Government Take ratio I have indicated in Part 1 of Guyana’s Petroleum Road Map along with discussing the other analytical issues referred to above.