Introduction
A significant number of readers have asked me to clarify/expand/repeat more simply the way in which I arrived at the “back of the envelope” or “ballpark estimates” of annual Guyana Government Take, which I offered in last week’s column. Most of these requests have come from readers who have neither read, nor followed clearly, the columns in which I had estimated 1) Guyana’s petroleum reserves potential; and, 2) the consequential daily rate of production (DROP) of barrels of oil equivalent (boe) this entailed. While, I cannot repeat these columns in detail here, I summarise the estimates they offered, indicating their publication dates where appropriate.
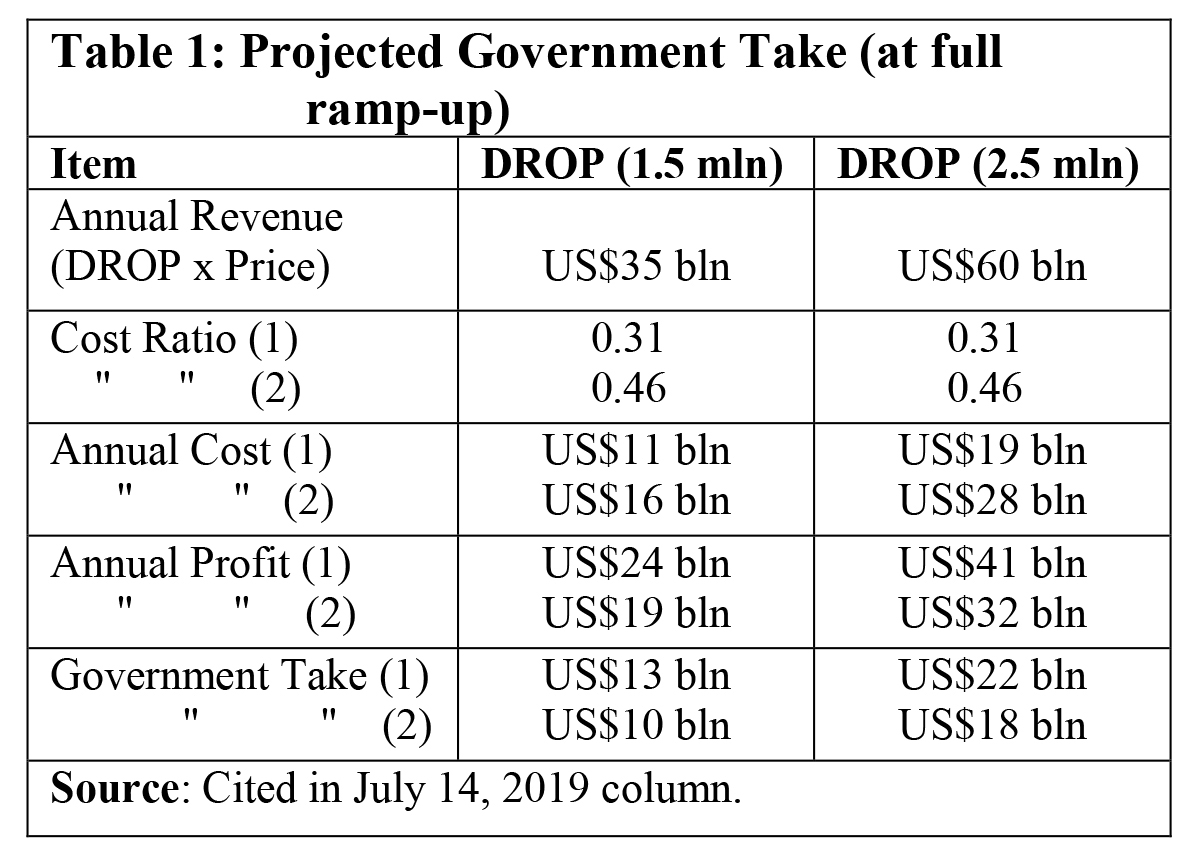
For this purpose, I proceed by way of indicating through Table 1 below (cited in last week’s column), how the projection was arrived at. To recall Table 1 indicates the results of my back of the envelope calculations, based on Rystad Energy’s analytics used for projecting Guyana’s petroleum earnings in the 2020s. These results are: 1) a DROP of 600,000 (0.6 million) boe; 2) annual revenue of US$15 billion; 3) annual total costs of US$5 billion; 4) annual profit of US$10 billion; and Government Take of 60%, leaving Contractor Take at 40%. The inferred price per boe is therefore US$75.
Thomas’ estimation technique
For starters, my ballpark estimates are calculated to the nearest US$ billion. More precision than this may mislead readers about the level of accuracy I attain! Second, the major differences in my estimations lie in the value of DROP (explained in the next paragraph). The two other differences are that I have a lower estimated price (US$70 per boe) as against US$75 and also a lower level of Government Take, 55% as against 60%.
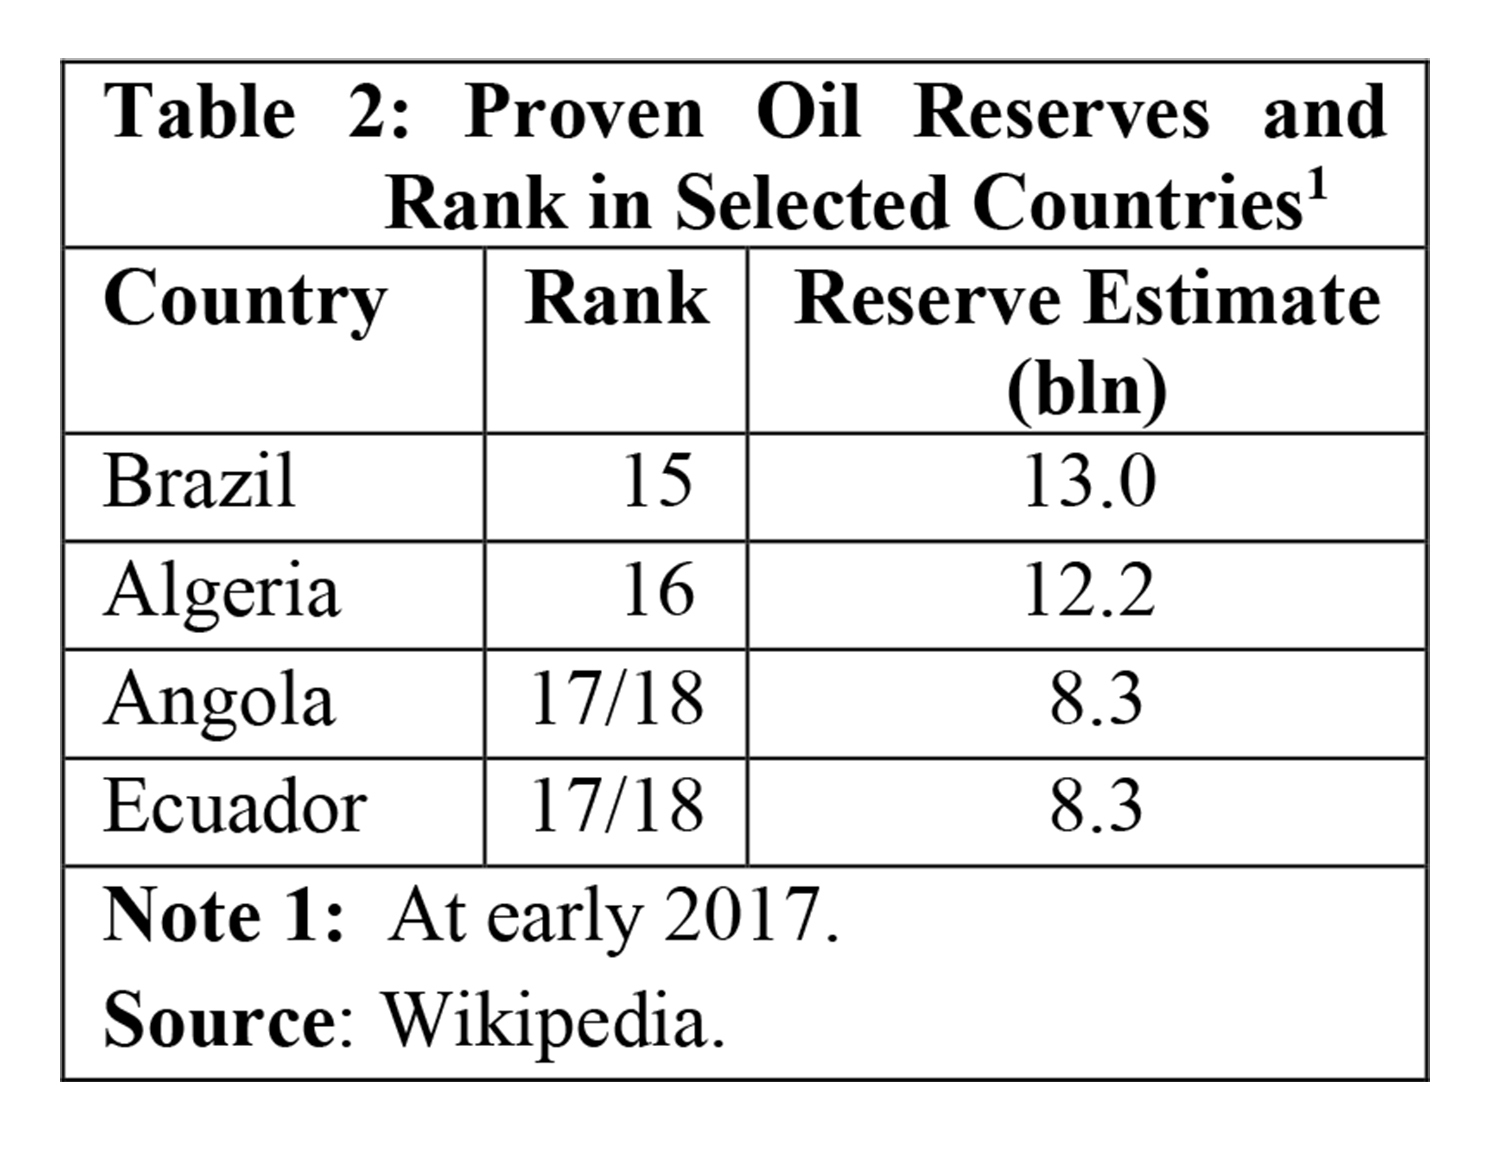
As indicated in my February 10, 2019 column, I am strongly “bullish” on Guyana’s petroleum potential. Indeed, I had declared them (based on my long-term strategic assessment of Guyana’s oil reserves), an amount of 13 to 15 billion boe. This was the Road Map’s ballpark estimate. And, how massive this prediction is can be gleaned from the global ranking of countries with proven oil reserves. At the beginning of 2017, Brazil was ranked 15 globally, with a holding of 13.0 billion barrels of oil reserves. Algeria was ranked 16, with a holding of 12.2 billion barrels. And, Angola and Ecuador, were ranked 17/18, as each had exactly 8.3 billion barrels of oil equivalent (see Table 2 below).
The next calculation was to formulate an estimate of Guyana’s DROP. For this I utilised a simple, indirect method. This method infers Guyana’s likely DROP, from reported DROPs for those countries ranked 15 to 18 in terms of petroleum reserves holdings. These four countries’ DROPs are, respectively, ranked globally as 10, 18, 11, and 26. These details are shown in the Table 3.
The indicated DROP for these four countries ranges from 2.5 million barrels a day (Brazil) down to 0.5 million barrels a day, Ecuador. The range is 2 million barrels and the mean is 1.5 million barrels per day. If we removed Ecuador’s DROP, which is below the current projection of 750,000 barrels a day for Exxon alone, the mean is then 1.9 million.
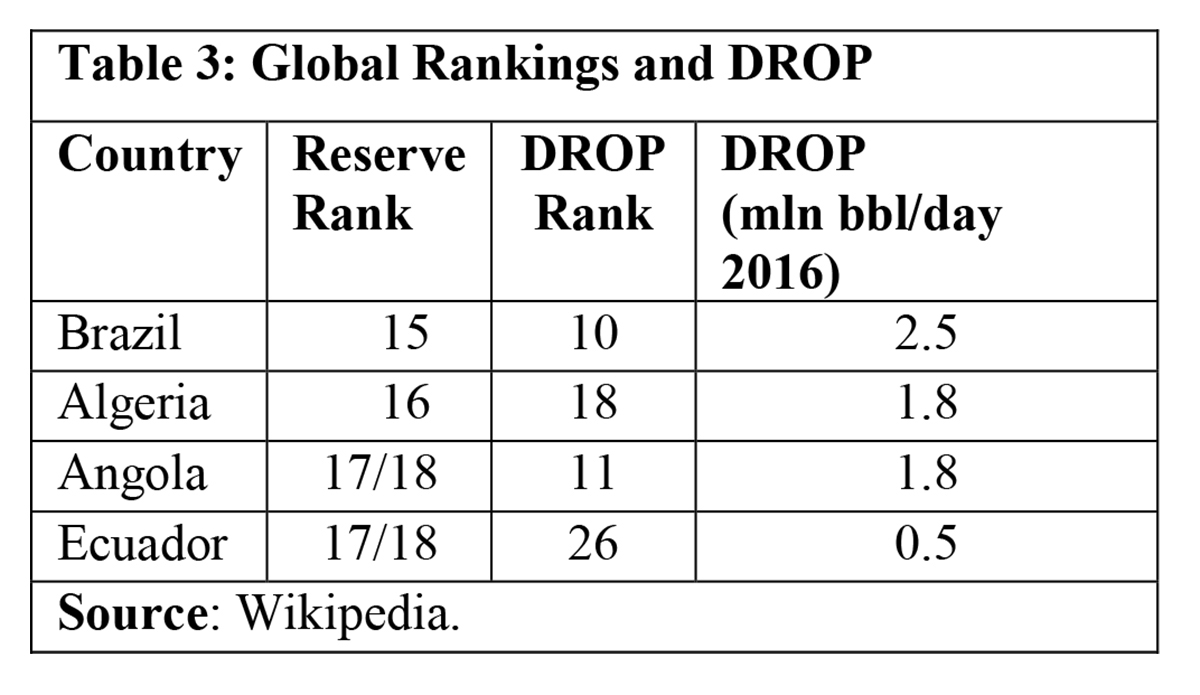
While there remains a mis-match of reserve holdings and production rank, the data do, nevertheless, provide for a range of DROP, which I anticipate Guyana can attain at maximum ramp-up. I therefore use this figure as the basis for estimating Guyana’s petroleum export earnings, at full ramp-up, I project therefore, that at maximum ramp-up Guyana could reasonably be expected to have a DROP of between 1.5 and 2.5 million boe.
Justification
In earlier columns, I had provided justification for both these estimates. That justification followed three principal lines of argument; namely, Guyana’s petroleum geology; authoritative estimates of Guyana’s potentially “recoverable resources” provided by US Geological Assessments, during the 2000s; and, a battery of comments and features on Guyana’s petroleum potential, as sourced from reputable energy research firms.
Observation
Annual revenue is mainly a function of DROP and price. My estimated DROP (ranging from 1.5 million boe to 2.5 million boe), is 2.5 to 4.2 times larger than Rystad Energy’s! My estimated price of US$70 per boe however, is US$5 or 7% less than the inferred price for Rystad Energy. These calculations are made to arrive at the respective annual revenues of US$35 billion and US$60 billion as shown in Table 1 above.
The inferred cost/price ratio for Rystad Energy’s cost of US$5 billion is 0.33. My estimation in Part 1 of the unit cost yielded a range of 0.31 to 0.46. This range is therefore applied to the data to determine cost at 1.5 million boe per day and 2.5 million boe per day respectively. The remainder, which is: [Revenue – Cost], yields the profit for the two DROPs displayed in Table 1.
After that the Government: Contractor Take ratio of 55:45 is calculated. By using this method I hold all of Rystad Energy’s analytics (for cost, price and profit) constant in order to arrive at my projection of annual Government Take. For Guyana, this ranges from a minimum of US$13 billion to a maximum of US$22 billion based on my ballpark estimates.
Conclusion
Next week, I address Guidepost 2, in Part 2 of the Road Map.