Introduction
Last week’s column introduced my proposed approach to the appraisal of the likely impacts of the 2020 global general crisis on Guyana’s infant oil and gas sector. Today’s column begins the detailed effort of that appraisal of these impacts (setbacks). I shall focus principally on economic impacts (setbacks) because these impacts are more amenable to identification and quantification than others; social, cultural and political.
However, given the subject matter of my concern (carbon emitting oil and gas), I am obliged to address, albeit briefly, direct environmental impacts (setbacks), in so far as the available data permit. Further, since my appraisal focuses specifically on near-term effects of the crisis, my coverage will be largely confined to performance over this year, 2020.
Approach
Based on the consideration that the 2020 general crisis drives the economic setbacks, inevitably, several economic variables will come into play. These include, but are not limited to: 1) movements in actual and forecasted 2020 global demand for petroleum products; 2) similarly, movements in actual and forecasted 2020 global supply of crude oil and natural gas; 3) given 1 and 2 above, their consequential effects on the actual and projected 2020 crude oil world market price; 4) this world market price as it relates to the actual and projected 2020 price that is obtained for Guyana’s crude sales; 5) actual and projected 2020 production and export of Guyana’s crude; 6) actual and projected production shares of Guyana’s 2020 crude oil export, which is obtained by the Owner (Government of Guyana (GoG) and Contractor (international oil companies (IOCs)); 7) actual and projected 2020 Government Take; 8) planned and updated/adjusted 2020 investments in exploration through production by the Contractor (ExxonMobil); 9) similar planned and later updated 2020 investments by the Guyana exploration-focused, but not-yet-producing IOCs.
Noise and Nonsense Redux
Before addressing the indicators listed in the Section above, I need to introduce several observations following responses of readers who felt my reference of the “noise and nonsense” elements and their “alarmism, misinformation and deception” in last week’s column, failed to identify “ignorance” as a contributory factor. As a teacher by trade, I am loathe to apply the word “ignorant” in reference to persons I disagree with, whether in public or private exchanges. For what it is worth however, back in March 2020 I had bemoaned the hysteria of this group and “the unjustifiable harm they were inflicting on the standing of the Owners (Government), operators (IOCs), governance authorities (public and private), as well as the broad mass of potential beneficiaries of Guyana’s world class petroleum finds”. I had also rebuked the relentless and organized onslaught on the stakeholders mentioned above.
It is true as pointed out, this group confuses or does not understand certain basic constructs. Its members seem to believe, erroneously, the higher is a tax rate, the larger is the Government Take! This is utter rubbish. Basically, they do not comprehend the notion of Government Take. This is a fiscal metric, or summary statistic which expresses the ratio of net present value obtained by the GoG from its oil wealth, divided by the net present value generated by all the oil projects, including Government Take. Failing to recognize this leads to such foolishness as the closer a tax rate is to 100 per cent (arithmetically the highest), the more it yields! They also confuse Guyana’s export earnings from oil sales with Contractor income. And further, they misuse as well “income,” which has to be expressed as either gross or net.
Measuring Impacts
The list of economic variables cited in the Section (titled Approach) is for the average reader, formidable. I will offer, therefore, for this approach, a summary measure of the totality of the economic impacts. Fortunately, there is such a broad economic measure that offers a proxy indication of how all these variables perform in any given period. That measure is the growth of Guyana’s Gross Domestic Product (GDP) at constant prices. Consequently, I use updated (and reduced) forecasts of Guyana’s GDP growth rate during 2020, as a measure of the economic value of the overall reverses or setbacks to the economy.
The World Bank’s World Economic Outlook (WEO) provides a simple and effective description of what GDP represents. As the WEO states: “it is the most commonly used single measure of a country’s (Guyana) overall economic activity. It represents the total value at constant prices of final goods and services produced within a country (Guyana) during a specified period of time (2020)”. The performance of Guyana’s oil and gas sector is therefore, captured in its GDP. Consequently, as estimates of this measure are updated, they capture impacts of the sector on the performance of Guyana’s GDP.
The updated forecasts reveal quite dramatic results. The original 2020 forecast made back in Q4, 2019 was based on the expectation of: 1) continued investment in the oil and gas sector in 2020; 2) an output of 102,000 barrels of oil per day on average; and 3) oil sold at US$64 per barrel. This forecast was made jointly by the Guyana Authorities and the IMF. At Q4, 2019, it revealed a whopping projected growth rate of 86 per cent for 2020. This rate was, easily, the fastest projected rate of growth for any country in the world for 2020!
That estimate has been since revised downwards substantially, following the rapid unfolding of the 2020 general crisis. The IMF’s recent forecast for GDP growth in 2020 is now 52.8 per cent. This compares with other estimates of Guyana’s 2020 real GDP growth rate made recently by other economic agencies. These data are summarized in Table 1.
Table 1: Projections of Guyana’s 2020 GDP(Constant Market Prices) Growth Rate
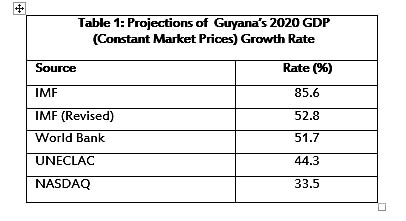
The recent revised growth rates, although varied, remain exceptionally high for all forecasts, alongside big downward adjustments in the rates. This result is testimony, I believe, to the striking advent of Guyana’s world class petroleum potential in its first year of start-up production. The recent forecasted rates range from 33.5 per cent (NASDAQ) to 52.8 per cent (IMF). This range represents a reduction of about 40 to 60 per cent of the original IMF rate.
Conclusion
Next week I shall wrap-up this discussion of the impacts (setbacks) caused by the 2020 general crisis, as revealed by updated forecasts of Guyana’s GDP growth rate. After that, I turn to consider the individual indicators listed in the Section above headed Approach.