Introduction
The global competitiveness of Guyana’s infant crude oil and gas sector and therefore foreseeable national economic growth, development and poverty reduction are over-determined by two basic economic variables and how they perform. These are the unit cost of production and the prevailing price for a barrel of oil equivalent (boe). Today’s column explores this cost-price relation. It focuses on two tasks: first, surveying the main elements of cost for Guyana’s crude oil and, second, looking at comparative global data on the cost – price relation for crude oil.
Pro forma template
The first question that arises is: what are the main items that typically make up the cost of a barrel of crude oil and gas. These vary in their presentation. Schedule 1 represents a pro forma template of those costs that energy analysts typically apply. Ten items are listed there, and each is briefly described in this Section.
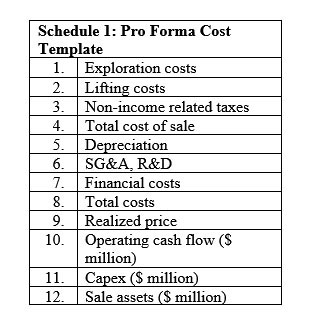 Item 1 (exploration costs) constitutes those costs incurred in the search for petroleum. That is costs incurred in determining the presence, location, quality, and economic appraisal of finds. Such activities also include research and exploratory well drilling. These latter are considered high risk because there is no guarantee of successful commercial finds. Item 2 (lifting costs) constitutes costs incurred after drilling is complete and are required to operate and maintain wells along with related equipment/facilities, including transport and labour costs. Item 3 indicates non-income related taxes, which are taxes other than income taxes the International Oil Companies (IOCs) pay, such as VAT, sales taxes and royalties. Item 4, total cost of sales, is the sum of items 1 to 3. These are direct costs attributable to the production of oil and gas.
Item 5, depreciation, constitutes accounting for “acquisition, exploration and development of oil and gas reserves”. It indicates the allocation costs for material assets employed over their useful life. Item 6, SG&A and R&D, represent selling, general & administrative expenses (these are the total direct and indirect selling expenses, as well as all general and administrative expenses, and as such it includes the costs of selling, delivering and managing the IOC), and research and development expenditure, respectively. Item 7, representing financial costs, comprises the standard items: cost, interest and other charges incurred from borrowing to purchase assets. These expenses are incurred from securing finance. Item 8, total costs, is equal to items 4-7. Item 9, records the realized price in the market per unit of oil and gas sold. Item 10, the operating cash flow, is a key performance metric. Item 11, capex is capital expenditure. And, finally, Item 12 indicates the sale of assets, if any, to finance capex.
The question that arises is how these costs are related to the selling price of crude oil. I address this below.
The broader global material
The cost-price relation, which is expected to emerge as Guyana commercializes its petroleum discoveries still remains a largely indicative exercise, simply because full ramp-up of production has not yet occurred. Nonetheless, from the perspective of the likely industry’s cost-price relation it is safe to claim, the greater is the positive difference between the overall unit cost of producing and distributing oil and gas and their market prices, the greater is the potential benefit for all beneficiaries, including the GoG.
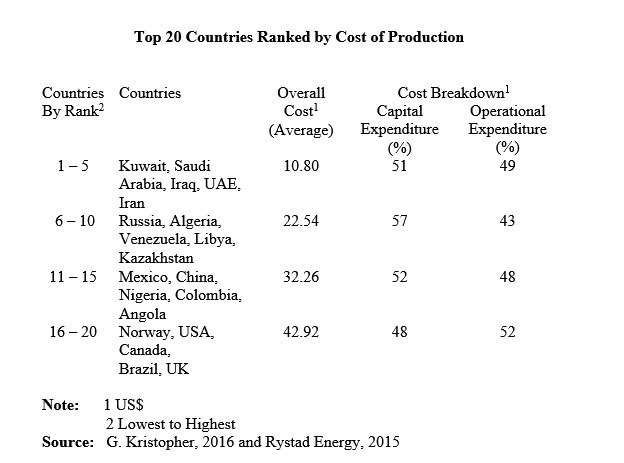
Back in 2016, when I introduced this observation I did not have the benefit of the 2018 Guyana modelling exercises cited earlier. I had instead introduced readers to the Schedule (reproduced below) showing the average unit cost of oil production for the top 20 producing nations. These are derived from operations in over 15,000 separate oil fields! Further, the Schedule computes costs separately as capital and operational expenditures.
As previously indicated, I have organized the data into four groups of five countries each; ranked from the lowest overall unit cost (1-5) to the highest (16-20). The average unit cost for each group represents a simple average of the reported cost for the 5 members of the group. This cost is further broken down into capital and operational expenditures.
What the data reveal?
First, the overall unit cost for the five highest cost producers’ group is four times larger than the lowest cost. Second, the country with the lowest overall unit cost, Kuwait @ US$8.50 has a cost less than one-sixth that of the highest; the United Kingdom @ US$52.51. Third, the range in overall unit costs is US$44.00. Fourth, the mean of the overall unit cost values is US$27.10. Fifthly, the median value is US$28.50. And, finally, variation in the overall unit costs is quite strong. For example, the mean absolute deviation is 10.50 and the coefficient of variation in the values is 0.474 and the relative standard deviation is 47.4 percent.
Relatedly, the average percentage distribution between capital expenditure and operational expenditure for all four groups of countries is 52:48. The data do not indicate a unique relationship between the size of national production and this ratio, except perhaps that the ratio is the worst (48:52) for the highest cost producers! However, the ratio does not consistently worsen across all four groups of countries, as their average size of production increases.
Conclusion
Next week I revisit the notion of a break-even price as this concept relates to the sustainability of Guyana’s infant oil and gas sector, which is at the heart of the discussion on the cost-price relation!