Introduction
In today’s column I continue with the summary recap and overview of my effort to evaluate the impact of the 2020 global general crisis on Guyana’s infant oil and gas sector. To recall, this effort is being pursued under four broad headings. Last week’s column addressed the first heading in its re-visit of my specification of the crisis and its unique footprints. Today’s column addresses the second heading. It takes advantage of the new year to gauge actual outcomes for the global economy in 2020. And, based on this, global crude oil trends and prospects for 2021 and beyond.
Next week’s column will then address the third heading. That is, the revealed impact of the global general crisis on Guyana’s economy and its crude oil and gas sector.
Unique features
History has consistently revealed that, while global crises have several common features, such as falling incomes, job loss, declining average per capita consumption, and increased risks; each crisis carries its individual and unique fingerprints. The 2020 global general crisis is no different in this regard as I sought to demonstrate in last week’s column. My concern here however, is not to advance crisis theory or even generate an original analysis of the 2020 crisis beyond a careful specification of its unique fingerprints to aid my analysis of its impact.
Therefore, I begin with Schedule 1, which lists 12 charts generated by the World Bank in a document reviewing 2020 global performance; 2020 Year in Review: The Impact of Covid 19 in 12 Charts. Although designed for broad public consumption, the document successfully captures the complex causes and effects of the 2020 global crisis.
Schedule 1: World Bank 2020 Review, 12 Charts
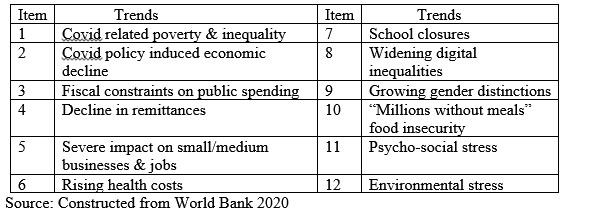
The Schedule above reveals an exceptionally wide mix of harmful effects on economic growth, income and wealth distribution, as well as death and destruction in 2020. The harmful effects cluster around four main negative trends. These are 1) accelerated economic decline, accompanied with job loss, increasing poverty, business failures and widening income and wealth disparities 2) worsening health conditions and related effects (hunger) 3) negative social outcomes at the individual, family and community levels and, 4) the operation of environmental stressors.
2020 economic growth
As I have repeatedly asserted in this column space, despite its well-known limitations, the annual change in real GDP of a country is, by far, the most accurate/effective representative single measure of a country’s economic performance over any period of time. Schedule 2 below shows the IMF estimated real GDP rates of change in 2020 for selected regions and countries. Global growth is estimated to have been negative at -4.4 percent. Similarly, all other regions and countries cited in the Schedule had negative rates of change as well. These negative rates range from -3.1 percent for the Emerging Markets and Developing Economies, EMDE, region, to minus – 8.1 percent in our Latin American and Caribbean Region, LAC. Readers should keep in mind that these are estimated outcomes; while noting they do in fact vary significantly even as they remain negative.
Schedule2: Global GDP % Change (2019-2021)
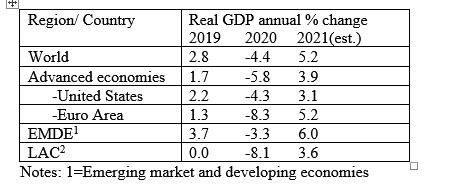
Notes: 1=Emerging market and developing economies
2=Latin America & Caribbean
Source: IMF, World Economic Outlook 2020
Accompanying this negative 2020 performance the data show the IMF outlook for 2021 is modest, albeit with varying rates of economic recovery. Further, the declining economic growth has been intertwined with declining global trade in goods and services. Thus, UNCTAD has reported a decline in trade in goods for every country except a few in East Asia; and I would add Guyana. Trade in services has fallen just as dramatically with UNCTAD reporting declines ranging between 13 to 32 percent across regions. Not surprisingly, we find the United Nations is reporting major setbacks in its efforts to achieve the global Sustainable Development Goals, SDGs, 2030. All the above indicate deepening global inequality.
Given this it should be noted that CEPAL has reported, the Latin America Caribbean, LAC, region is likely to be the worst hit region worldwide, in terms of health and social inequality indicators. I would add, except for Guyana.
Crude oil outcomes
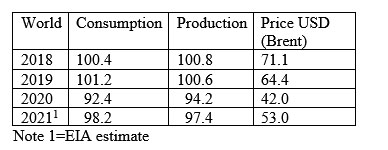
The question raised by the 2020 outcomes cited above is: what are their effects on the global crude oil sector, particularly global consumption, production, and price of crude? Falling incomes, health restrictions (social distancing), public policies (lockdowns) have all had a severely restrictive impact on the global energy market. Thus, the EIA data shown in Schedule 3 reveal a sharp reduction in global crude oil consumption in 2020. This consumption was about 8 million barrels less per day than in 2019. Significantly, consumption projected for 2021 at 92.4 million barrels per day remains below the 2019 level.
Global production reveals a similar pattern as can be seen from the Schedule; a sharp decline in 2020 and a less stellar increase in 2021. Not surprisingly price behaviour is similarly patterned. There is a sharp decline from US$71.1 per barrel in 2019 to US$42 in 2020. And the forecast for 2021 at US$53 does not recover to anywhere close to the price that obtained in 2019.
Schedule3: Global Crude Oil, mln bbls (2018-2021)
Conclusion
Next week I move on to address the impact on Guyana’s gas and crude oil sector.