Introduction
Table 1 shows various estimated GDP growth rates data for Guyana in 2020. I had referenced these last week as proxies for the adverse impacts of the 2020 general crisis on Guyana’s infant oil and gas sector. The starting point is the joint IMF/ Government of Guyana (Authorities) projection of an 85.6 growth rate for2020, announced during Q4 2019. At that time, this was the fastest projected rate 2020 growth rate of real GDP, worldwide. The table indicates the IMF has made three subsequent reductions to this estimate; one each in Q2, Q3, and Q4, 2020. The rate fell to 52.8 percent, 26.2 percent, and finally to 8.1 percent respectively.
Furthermore, a separate estimate has been provided by the new government in its 2020 National Budget (48 – 51 percent). This was later revised to 43.5 percent in the 2021 National Budget. The Table further reveals that estimates provided by three other bodies (NASDAQ, UNECLAC and the World Bank) conform to the revealed pattern of reduced estimates the further into 2020 these are made.
Table 1: Guyana Projected 2020 GDP Growth Rates (constant prices)
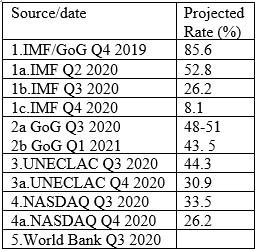
Source: Author’s construction
These data encompass two notable extremes. First there is the dramatic reduction in the IMF growth rate projections. These fell from 85.6 percent in Q4 2019 to less than one-tenth of that value by the end of 2020, 8.1 percent. This is a staggering commentary on the impact of the 2020 general crisis. I believe this observation holds true even if one dismisses the initially projected 85.6 percent as likely exaggerated. Second, the other extreme rests on the fact that a rate of real GDP growth of 8.1 percent for 2020 is equally staggering, bearing in mind how economies have fared worldwide during 2020. It is also of note that the most recent 2020 estimate of 8.1 percent, is 2.7 percent or 50 percent larger than what obtained in 2019!
Rationale for Proxy Indicator
The main challenge to the proxy indicator is likely to be its dependence on the GDP measure. The summary definition of the GDP that I had earlier provided is taken from the World Economic Outlook. This is indeed used by the IMF to define GDP for the general readership of its documents.
Although in practice it is very difficult to reduce to a single construct, any country’s innumerable transactions, activities or incomes generated in its economy, this measure is now universally accepted as the best available. Furthermore, the GDP is calculated using globally accepted methodology through the United Nations System of National Accounts methodology. This circumstance ensures standard results, which can then be used to compare across countries. As a consequence, Investopedia claims the GDP is, “despite limitations, a key tool to guide policy makers, investors, or strategic decision-making … It is a comprehensive scorecard of the economic health of a country for a given period”. This is a truly powerful endorsement.
Having pointed out the above, I hasten to admit however the GDP, as a measure, has been frequently, challenged. So far though, no challenge has come close to replacing its use as a universally accepted economic measure.
For full disclosure I admit to four limitations of the GDP, which if taken together make the concept less than perfect. These are: 1) its focus on measuring only those transactions that take place in markets. Consequently, it excludes unpaid labour (like household help), or informal activities outside of formal markets 2) it does not measure data on jobs and unemployment generated by the GDP, although it covers investment. 3) it measures overall income but not the manner in which that income is internally distributed. In other words, who gains and who loses as GDP is produced, and 4) it does not speak to the sustainability of the growth rate.
Although the original Q4, 2019 IMF forecast for 2020 was as high as 85.6 percent, for the following year 2021, the IMF had projected a rate of 4.8 percent; and the 2021 National Budget projects 20.9 percent. For comparison, Table 2 shows Guyana’s actual GDP growth rates for 2014 to 2019.
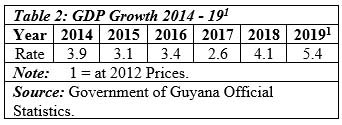
To recall, Guyana’s First Oil started in late December 2019, and the first shipment of profit oil took place in Q1, 2020. The more robust growth rate of 2019 revealed above, was due to income (GDP) generated by pre start-up expenditures of ExxonMobil, the lead Contractor.
At this point, I shall leave for now, further discussion of updated changes to Guyana’s GDP growth rates during 2020, as a measure of the 2020 economic setbacks occasioned by the unfolding 2020 general crisis. The focus so far has also been on appraising impacts at a macroeconomic level. Going forward, I focus more on particular sectors using a microeconomic approach.
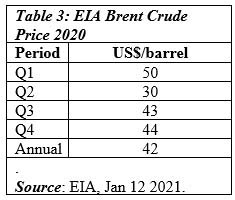
Turning briefly to the price data, the US Energy Information Administration, EIA, quarterly Brent crude price data for 2020 are shown in Table 3. The Brent price is reported to be the price against which Guyana’s crude is fixed in a range of US$1.50 to US$2.0 discount per barrel on “dated Brent”. For readers information dated Brent is the price paid for “physical cargoes of crude in the North Sea that have been assigned specific delivery dates”.
Conclusion
Next week I continue this train of thought.