
The past three columns explored the government’s overdraft at the BoG. We learned that spending from the account intensified from around 2011 and the balance turned negative towards the end of 2015. This is an example of monetary financing in the presence of a previous domestic debt ceiling. Guyana is teaching the world monetary economics, a gold mine for academics like me.
Guyanese politicians have demonstrated that money financing of deficits does not only occur when a central bank directly buys bonds or Treasury bills from the government. Guyana uses a different framework (known to Neo-Chartalists) in which the government emits payments from its central bank account. This injects money into the economy and the BoG, in turn, mops up the excess reserves by selling Treasury bills to the banks and other institutional investors. All of this raises several questions regarding inflation and other macro pathologies. The inflation issue will be looked at in a future column.
Today I want to explore the largest current expenditure of the government: wages and benefits. These amount to the largest category of government spending, which we learned in the past three columns was increasingly financed by money creation. The increase in the domestic debt ceiling will now address this issue by switching out the excess reserves with Treasury bills and possibly other forms of sovereign securities.
It was noted in the previous column that for the period 2008 to 2020, wages and benefits account for 66.5% of total government expenditure. In 2016, it went up to an astounding 92%. This is an anomaly by Caribbean standards and perhaps many other parts of the developing world. The implication is not a lot of money remains for capital expenditure on things such as drainage and world-class infrastructure. Had Guyana not had the good fortune of discovering oil, I believe this imbalance would have had serious implications for development spending and would have required retrenchments and social unrest in order to address.
Oil will now allow the political leaders to push the problem a decade down the road. The public service is likely to be expanded more because the political pressure requires that PPP/C brings in its activists as the PNC did earlier. It furthermore implies that capital expenditures will be funded by mainly the Natural Resource Fund, which defeats one of the purposes for having such a fund in the first place. It is likely that the government is going to borrow externally to finance development projects. It was noted that the gas-to-shore project will likely be financed by a de facto loan from ExxonMobil. The loan will run over a billion US$ once we consider the interest rate and lurking expenses that I noticed have not been disclosed to the public. One of the sins of public management is to borrow from foreign private banks or entities which are beholden to shareholders and Wall Street.
In the case of Barbados, wages and benefits account for 23% of government budget expenditure from 2008 to 2020, while it amounts to 33.8% in Jamaica and 16.5% in Trinidad and Tobago for the same period. It is also useful to compare the wage bill with gross national income (GNI), which is a cousin of GDP but a more relevant measure for us. As a percent of GNI, the wage bill for Guyana was an average of 15.3% over the period 2008 to 2020. The same average for Barbados over the period 2008 to 2020 was 2.6%, while it was 10% in Jamaica and 5.6% in Trinidad and Tobago. Again, we can see that Guyana is a leader in this problematic area. Guyana’s contentious politics and the need for the winning party to reward its electoral base could be a major explanatory factor as to why Guyana leads. It could also imply that government budgets are done in silos, whereby the capital expenditure side is done in isolation of the people responsible for current expenditures.
What does all of this imply for the average pay of a Guyanese public servant? How does the average compare with Guyana’s per capita income? As a refresher, the per capita income is the average income for all Guyanese, regardless of whether they work in the bauxite, gold or rice industry. It is a rough measure, but a useful one nevertheless. The average pay of a worker in the public service is the total wage bill divided by the number of workers. In last week’s column, I noted that the government employment dataset ends at 2018. Therefore, all the numbers I report henceforth are for 2008 to 2018. I start my analysis from 2008 because it’s the furthest back I can find online on the website of Ministry of Finance.
Table 1 reports the average (per capita) income for Guyana and for the public service. The third column shows the ratio of pay for government workers to the average Guyanese income. Before discussing the trends in the data, let’s consider the average for the period under review. The average income is US$5, 185 compared with an average public sector pay of US$39, 473. This means that on average the public sector worker earns 7.8 times more than other Guyanese. At the current exchange rate, the average pay in the public sector is approximately G$8.3 million per year.
Now, I want to make it clear that I do not believe that this pay reflects the income of the nurse, the school teacher, the police officer and the clerks. As I noted in the last column, it would be better to have the data by seniority or rank and by contract workers. The total wage bill does include contract workers but it is impossible to know the pay by rank since the data is not made publicly available. I hope a researcher will pick this up one day. For now, I will rely on the rough measure that is the arithmetic mean.
Table 1: Average pay of government worker versus all Guyanese
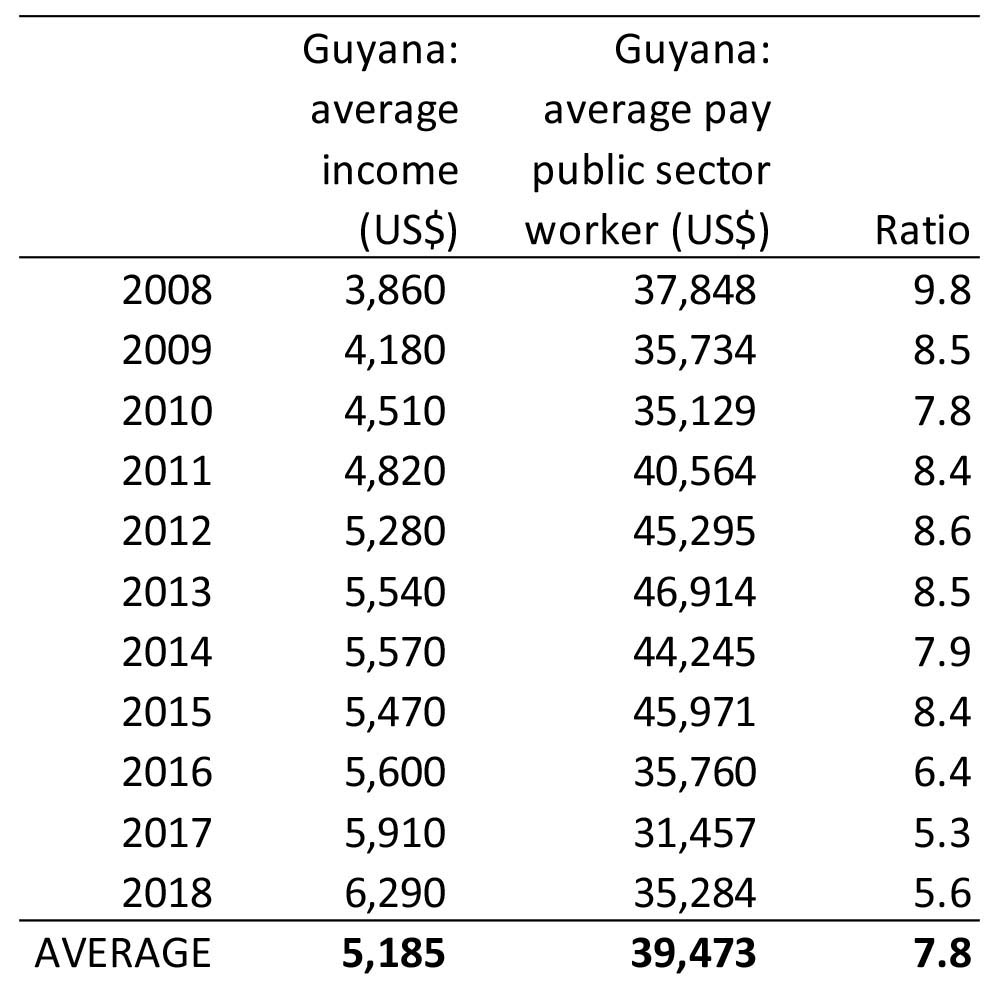
It means that the public sector wage bill is largely shared by a few highly paid individuals who are likely to be political operatives. These folks have to be earning super salaries close to six-figure American dollar salaries. That is the only way the average can be so high. Moreover, the public service pay is unlikely to be structured in order to reward and promote meritocracy.
As can be seen, the ratio was higher – on average – for the PPP/C years, thereby being consistent with my thesis that its patronage system is relatively more inequality-inducing compared with the PNC’s. The logic is the PPP/C has to reach out beyond its base because it does not possess control of certain core power centres. However, the PNC is more likely to promote egalitarianism mainly within its ethnic base. The PNC’s strategy, moreover, is premised on a belief that it can seize power and hold on to it. Will the PNC be able to think out of its little box?
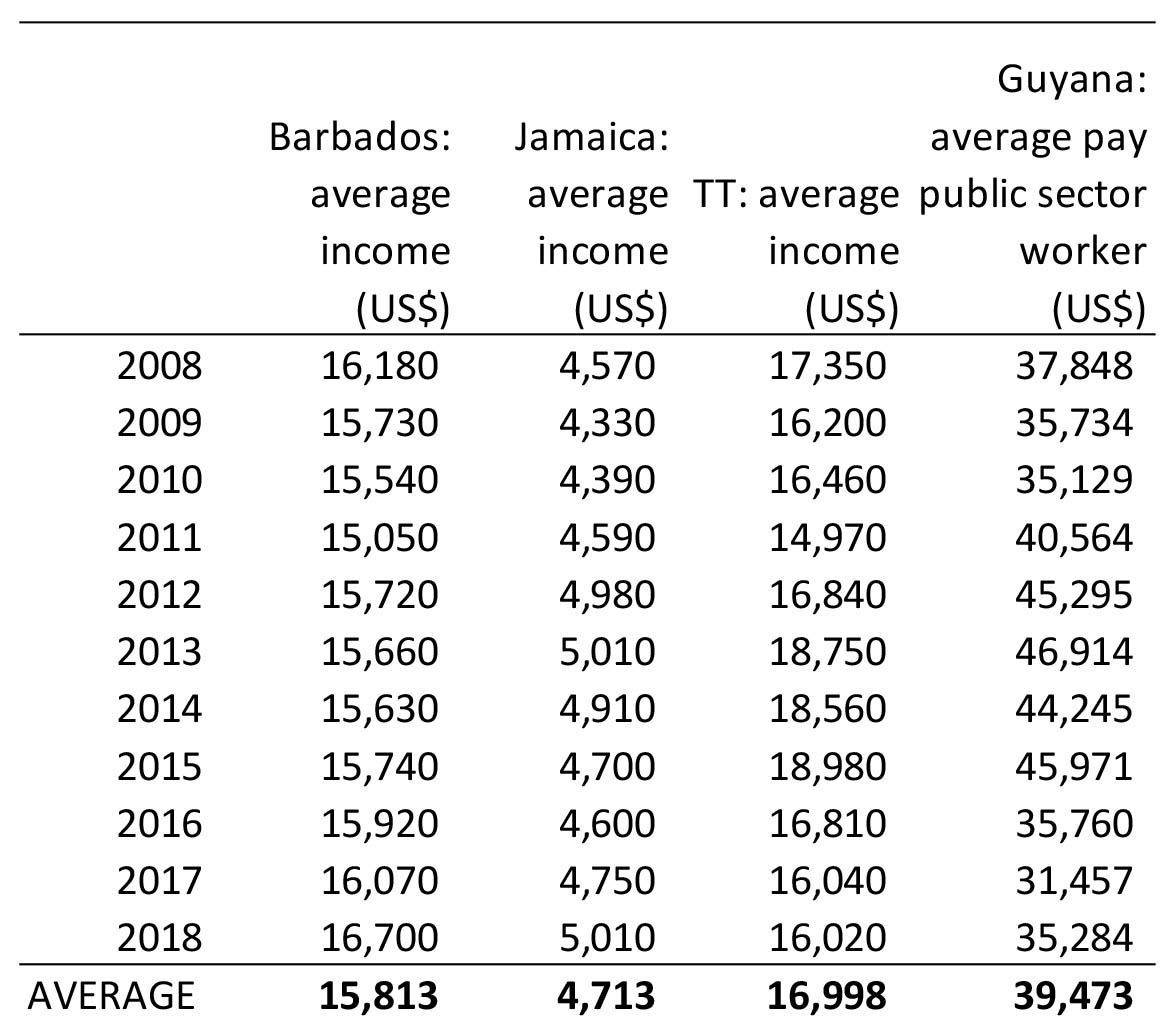
How does the average pay in the Guyanese public sector compare with that of the per capita income of Barbados, Jamaica, and Trinidad and Tobago? Table 2 answers this question. The final column in the table replicates the average public sector pay to make it easy for comparison. As the reader can observe, the average pay handsomely beats the level of per capita income of those three CARICOM countries.
Table 2 Average income in three CARICOM countries vs Guyanese public sector
Civil society groups are obsessed with oil and gas as they probably should be. But here is a big problem of misallocation of scarce resources which has been happening at least since 2008. An outcome of this misallocation is, going forward, growth-augmenting capital expenses will have to be financed by volatile oil revenues since most taxes are paying salaries. The only way to smooth this out in the short- and medium-term is to commit the “original sin”: undertake external debt.
Civil society has to demand a reform of the civil service. They must also demand a release of the data and pay of contract workers. They must demand that a career civil servant head the government services. They must demand that speakers at political rallies are not made permanent secretaries. Finally, there should be freeze on pay for senior employees and only junior ranks should have a pay increase for a few years.
Comments can be sent to: tkhemraj@ncf.edu