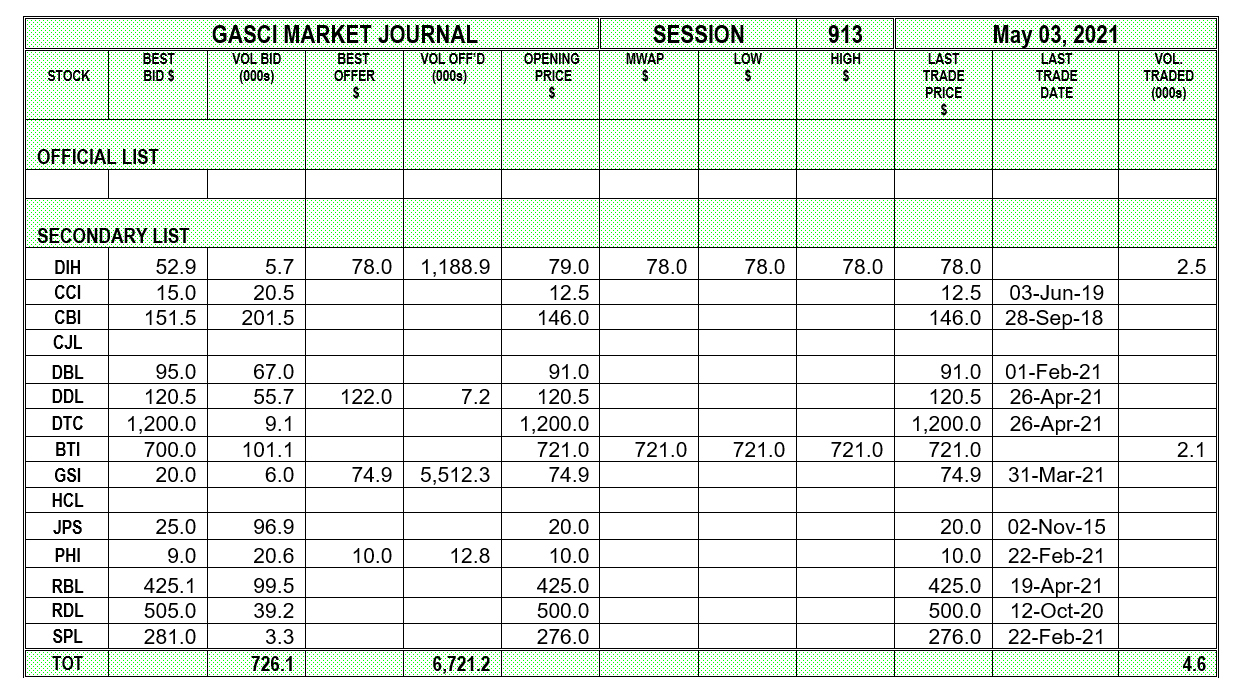
GASCI (www.gasci.com/telephone Nº 223-6175/6) reports that session 913’s trading results showed consideration of $1,683,338 from 4,550 shares traded in 3 transactions as compared to session 912’s trading results which showed consideration of $9,113,558 from 104,987 shares traded in 13 transactions. The stocks active this week were DIH and BTI.
Banks DIH Limited’s (DIH) two trades totalling 2,484 shares represented 54.59% of the total shares traded. DIH’s shares were traded at a Mean Weighted Average Price (MWAP) of $78.0, which showed a decrease of $1.0 from its previous close of $79.0. DIH’s trades contributed 11.51% ($193,752) of the total consideration. Both of DIH’s trades were at $78.0.
Guyana Bank for Trade and Industry Limited’s (BTI) single trade of 2,066 shares at $721.0 represented 45.41% of the total shares traded. BTI’s shares were traded at a Mean Weighted Average Price (MWAP) of $721.0, which showed no change from its previous close. BTI’s trade contributed 88.49% ($1,489,586) of the total consideration.
Best bid: The highest price that a buyer is willing to pay for a security.
Best offer: The lowest price at which a seller is offering to sell securities.
TERM OF THE WEEK
Front End Loading: Some investment products such as life assurance policies and unit trusts have a higher charge in the first year or when units are purchased. This is referred to as front end loading.
Source: Dictionary of Financial and Securities Terms.
Contact Information: Tel: 223 – 6175/6
Email: info@gasci.com
Website: www.gasci.com
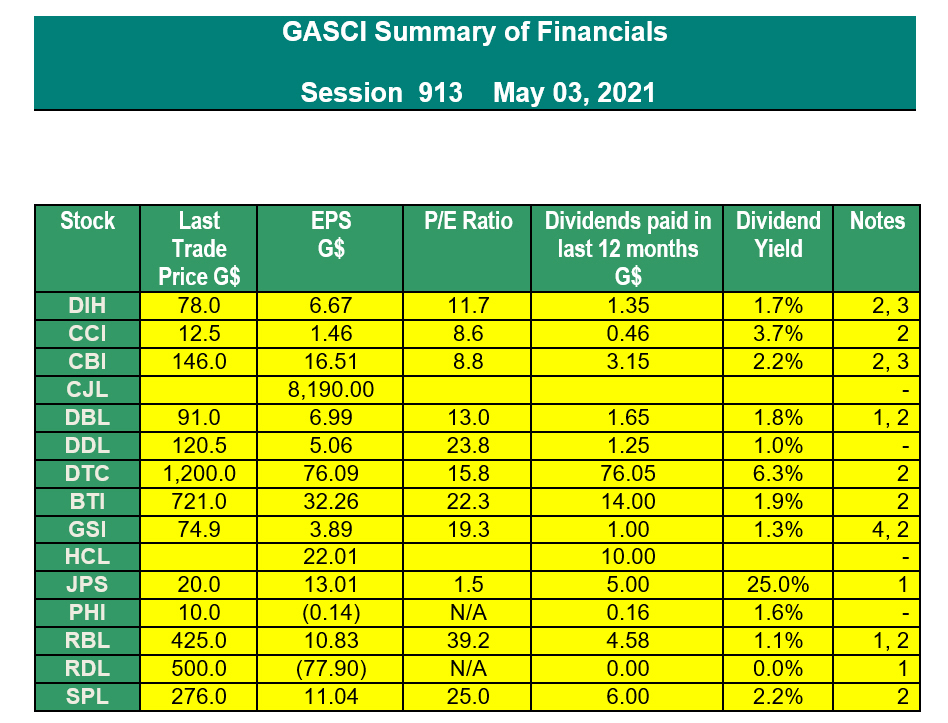
Notes
1 – Interim Results
2 – Prospective Dividends
3 – Shows year-end EPS but Interim Dividend
4 – Shows Interim EPS but year-end Dividend
EPS: earnings per share for 12 months period to the date the latest financials have been prepared. These include:
2016 – Final results for CJL and PHI.
2019 – Final Results for HCL.
2020 – Interim Results for GSI, JPS and RDL.
2020 – Final Results for BTI, CCI, DIH, CBI, DDL, DTC and SPL.
2021 – Interim Results for DBL and RBL.
As such, some of these EPS calculations are based on un-audited figures.
P/E Ratio: Price/Earnings Ratio = Last Trade Price/EPS
Dividend yield = Dividends paid in the last 12 months/last trade price.
The market information provided here is provided for informational and educational purposes only and is provided on a time-delayed basis. GASCI does not guarantee the accuracy or completeness of any information contained on this page. Although the information has been obtained by GASCI from sources believed to be reliable, it is provided on an “as is” basis without warranties of any kind. GASCI assumes no responsibility for the consequences of any errors or omissions. GASCI does not make or has not made any recommendation regarding any of the securities issued by any of the companies identified here nor the advisability of investing in securities generally for any particular individual.