Introduction
Today’s column continues my rather extended interrogation cum discussion (over the past several weeks) of the plethora of mis-representations, deceptions, and plain fake news put out ceaselessly in the social and print media by the local and external purveyors of noise and nonsense directed at Guyana’s emergent oil and gas sector. As earlier indicated the motives behind this onslaught are varied even though laser focused on portraying, explicitly and implicitly, Guyana’s oil and gas sector as doomed to failure and, indeed, deservedly so! In pursuit of this agenda, the noise and nonsense contingent is consigning the broad mass of their fellow Guyanese to continued immiseration, persistent want and poverty
 Thus far, I have concentrated this interrogation cum discussion of these phenomena to three main areas, in my effort to identify and illustrate some of the best examples of the mis-representations, deceptions, and fake news being promoted. These areas are: 1) attributing damage to the planet from greenhouse gas, GhG, emissions which are generated by crude oil producers, as if this occurrence was confined solely or primarily to “big oil” producers. As revealed, the reality is that GhG emissions are occurring in a circumstance where, as I have repeatedly noted National Oil Companies, NOCs, produce more than one-half of global crude oil from the trillions of US dollars in assets they possess; 2) pejoratively labelling as mere “crumbs”, projected financial returns for the Government of Guyana, GoG, ranging from 50 to 60 percent of net cash flow, under the terms of the ruling PSA; and 3) manipulated and deceptive reporting of cost of production, which is designed to make it appear that giveaway cost provisions under the ruling Production Sharing Agreement, PSA, leave little or no profit after cost oil provisions are met.
In relation to the above, readers would recall that I have used in some detail, the data reported in the IADB’s Technical Note, published in August, last year (2020) to counter some of the grosser mis-representations, deceptions, and fake news. To repeat for emphasis, the IADB had estimated the average effective rate of taxation under the ruling PSA for the first five Exxon and partners listed projects scheduled for completion in 2025/6 at 51 percent. Additionally, the IADB estimate of the per barrel cost of production for the five principal elements of cost in the same projects are, in descending order of magnitude: OPEX, US$7.4; CAPEX, US$4.7; De-commissioning, US$2.9; Drilling, US$2.5; and, Exploration, US$0.7. The projected total cost per barrel is US$18.3. These cost items per barrel, represent approximately, 40, 26, 16, 14, and 4 percentage points respectively, of the estimated total cost per barrel of US$18.3 indicated above.
The fiscal regime absurdity
Cynically, the noise and nonsense grouping portray to unsuspecting consumers of its fake news a circumstance in which each component of Guyana’s 2016 PSA is treated as a stand- alone item. This deception is crafted in order to draw attention to its “revenue claim” as being either too low or significantly less in comparison to what exists in other jurisdictions! This is an absurdity since the range in individual items of taxation globally, as well as other fiscal tools are described in basic textbooks as “limitless”. This circumstance results in an outcome where each country’s fiscal regime should be adjudged legally as unique. Its effectiveness/efficiency depends on the conditions facing the country, along with its proven oil and gas reserves.
The absurdity this practice perpetrates on an unsuspecting public is vile. Because of this more than three years ago in this column series I had drawn readers’ attention to the fact that, several instructional manuals, texts, and other such material seek to aid students/readers to grasp that it is the unique character of every contract that matters and challenge them to select, a priori, the best option for the State from among a few examples they provide.
Following this practice, three years ago, in March 2018 I had constructed the Schedule below, which provides five Options, from which I had invited readers to identify the “best option for the State”.
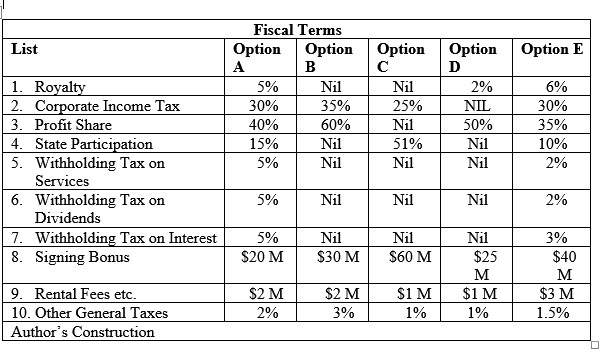
Certain features in the example immediately stand out in the Schedule. These are: 1) two Options have all 10 taxes listed (Option A and E; two Options have only 5 taxes listed B and C; and, only one has 6 taxes listed (Option D) 2) the highest fiscal component is a profit share of 60 percent, found in Option B 3) the lowest tax, one percent, is found in Option C and D 4) there is State Participation in 3 of the Options (A, C and E) 5) this State participation ranges from majority, 51 percent in Option C to 10 percent in Option E and no State Partnership in the two remaining Options B and D.
Conclusion
Based on the examples shown above, there is clearly no way to establish by comparison of stand-alone tax rates, the ranking of the average effective tax yield for the displayed options without knowledge of concrete country circumstances.
Next week I wrap-up this mini-series on the noise and nonsense, which the social and print media relentlessly hurl at Guyana’s emergent oil and gas sector.