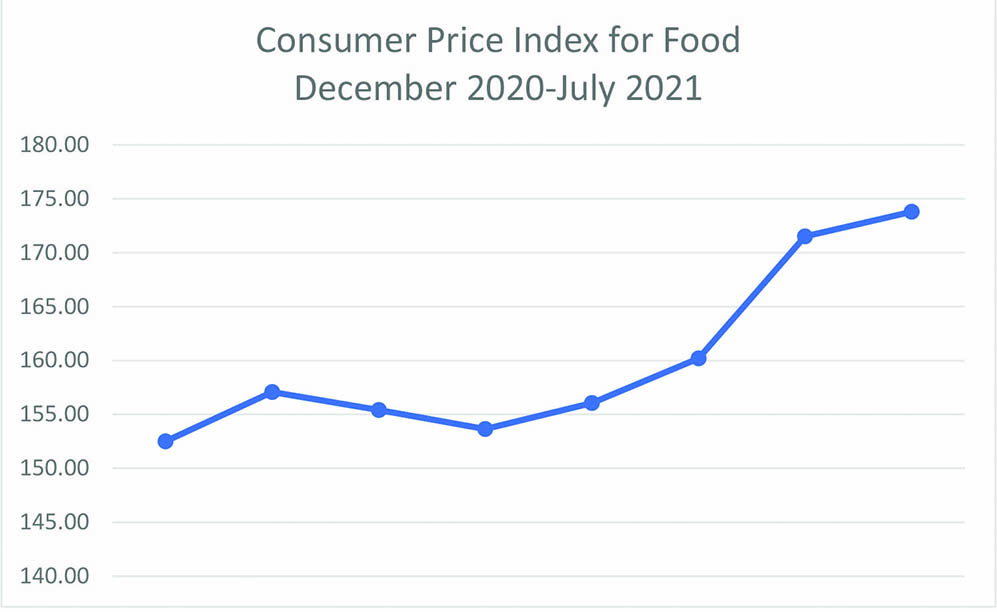
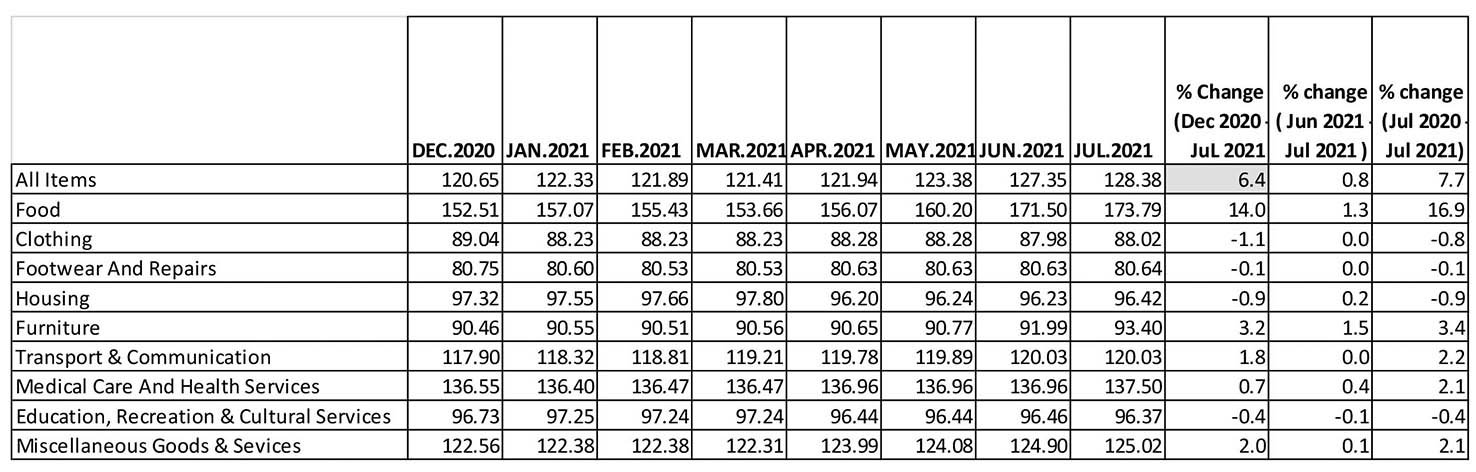
According to data from the Bureau of Statistics there has been a 14% increase in food prices over the first seven months of 2021 while general living costs have increased by 5.4% over that same period.
According to the monthly Consumer Price Index (CPI) the cost of living in Guyana has seen a steady increase over the last few months with food prices most significantly affected.
Stabroek News has previously reported that at least some of the cost increases in food and other items are related to the COVID-19 pandemic which has caused a disruption to the shipping routes and food production across the world.
 In May it was explained that according to the Food and Agricultural Organization’s (FAO) world food index, global prices have increased for an 11th consecutive month in April, hitting their highest level since May 2014.
The index, which measures monthly changes for a basket of cereals, oil-seeds, dairy products, meat and sugar, averaged 120.9 points in April versus a revised 118.9 in March. It was 30.8 % higher than its level in the same month last year.
At the time the organization explained that worries about crop conditions in Argentina, Brazil, and the United States, pushed maize prices up 5.7% while wheat prices held largely steady. The vegetable oil price index rose 1.8% as international palm oil quotations rose on concerns that production growth in major exporting countries would be slower than expected. Soy and rapeseed oil values also climbed further, while sunflower oil prices contracted moderately.
Dairy prices rose 1.2%, with butter, skim milk powder, and cheese all lifted by solid demand from Asia, while the meat index climbed 1.7%.
Since that time however there has been a decrease in world prices at least for two months. The FAO in July recorded its second month of lower world food prices. That month the Food Price Index averaged 123.0 points in 1.2 % lower than the previous month although still 31.0 % higher than its level in the same period of 2020. The July drop reflected declines in the quotations for most cereals and vegetable oils as well as dairy products. Of specific note was that the Cereal Price Index was 3.0 % lower in July than in June, pushed down by a 6.0 % month-on-month drop in international maize prices associated with better-than-earlier projected yields in Argentina and improved production prospects in the United States of America, even as crop conditions in Brazil remained a concern.
The cost of other coarse grains such as barley and sorghum also dropped significantly, reflecting weaker import demand while the international rice prices hit two-year lows, impacted by currency movements and a slow pace of sales caused by high freight costs and logistical hurdles.
In August the index averaged 127.4 points, up 3.9 points (3.1 %) from July and 31.5 points (32.9 %) from the same period last year.
The FOA explained that once again reduced harvest expectations in several major exporting countries pushed up world wheat prices while lower barley production outlooks, especially in Canada and the United States of America, and spillover from rising wheat prices pushed up international barley values while maize prices registered a slight decline. Meanwhile, international rice prices remained on a downward trajectory in August.
A similar analysis of the changes in the local price indices has proved difficult since Guyana does not publish the products which are included in its basket of goods. This newspaper reached out to the Bureau of Statistics to request information on the products included but was told that “this is information that we do not disseminate”.
Asked to provide an explanation Deputy Chief Statistician Maxine Bent noted that the Acts governing the Bureau prevent the release of any informations which was not included on its website.
“The broad categories which are available on the website are what we publicly release, Bent maintained while explaining that the basket of good is actually being updated using information obtained from the household budget survey conducted in 2019.