
The Preliminary Census 2012 attributes the coastland’s smaller household size to an increase in single parent households, but this needs to be examined. In 2012 the total number of households in Guyana was 210,124; 40 per cent higher than what it was in 1980 (149,731) and 15 per cent higher than at the start of the last intercensal period (154,153)
Introduction
Today’s column concludes my discussion of the 2012 Preliminary Census. So far, I have highlighted 1) the persistence of long-standing net outward migration ; 2) the likely persistence also of human capital flight or brain drain over this period; and 3) that deep long-lasting historical features underline the evolution of Guyana’s population.
Readers should note that well-executed population censuses are much more reliable and statistically accurate then sample surveys; other limited or indirect statistical indicators of population behaviour including the examination of registers of births and deaths, visas issued or official immigration records and demographic models. Indeed I would go further and argue that periodic ten years censuses are in effect audits of these types of indirect estimations of population during the intervening census years.
This week I consider the 2012 Preliminary Census information related to household size and distribution, gender distribution (or sex ratio), and building stock.
Households
The 2012 Preliminary Census defines a household as a place where one or more persons (irrespective of their relation) sleep under one roof for at least four nights a week and share at least one daily meal. Table 1 reveals a three-decade long decline in the average size of households. Thus the 1980 Census revealed a household size of 5.07 persons and by 2002 the average size was 4.11 persons. At the time of the 2012 Census this was further reduced to 3.56 persons.
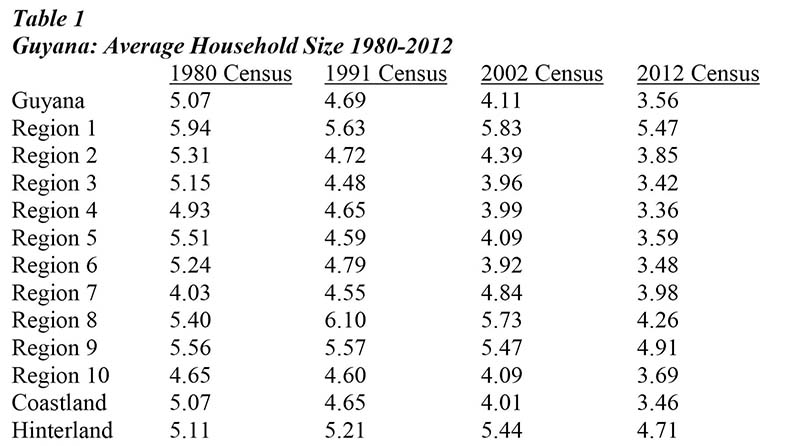
Source: Bureau of Statistics, 2012 Preliminary Census Report , 2014
The average household size in the hinterland area was higher than the coastland’s throughout the four census periods. Indeed this peaked at 5.44 persons in 2002 after increasing consistently since 1980. In 2012 it declined for the first time since 1980 to reach 4.71.
Regions 1,7,8,9 recorded the largest household sizes in 2012 ranging from 3.98 in Region 7 to 5.47 in Region 1. The average hinterland area’s household size, which was 4.71 in 2012 contrasts with the coastal area where the household size had fallen to 3.46 persons for that year.
The Preliminary Census 2012 attributes the coastland’s smaller household size to an increase in single parent households, but this needs to be examined. In 2012 the total number of households in Guyana was 210,124; 40 per cent higher than what it was in 1980 (149,731) and 15 per cent higher than at the start of the last intercensal period (154,153).
Gender distribution
In the 2012 Census the gender ratio refers to the statistical distribution of the population into males and females expressed as a proportion of the entire population. Table 2 reveals that nationally males were 49.8 per cent of the total population and females 50.2 per cent. Region 1, 7, 8, and 9 were all above the national average with Region 6 equal to the national average.
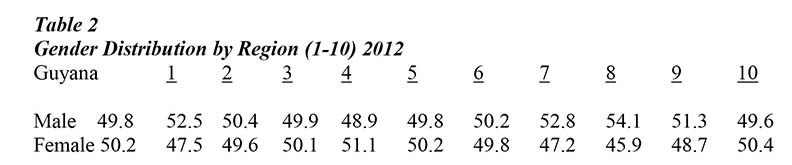
Source: Bureau of Statistics, 2012 Preliminary Census Report , 2014
Region 4 had recorded the lowest ratio of males (48.9 per cent) and Region 8 the highest (54.1 per cent). The Preliminary Census Report 2012 has recommended an independent study of the sex ratio in the hinterland and coastal areas.
Building stock
Finally, I direct readers’ attention to building stock. Table 3 shows a substantial increase in building stock over the intercensal period (rising from 187,696 buildings in 2002 to 219,509 in 2012). This increase (31,813 buildings) was about 17 per cent.
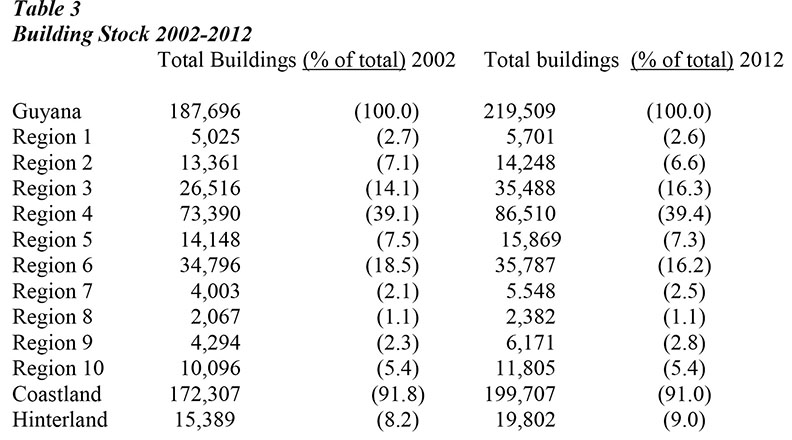
Source: Bureau of Statistics, 2012 Preliminary Census Report , 2014
Table3 reveals that the distribution of building stock across the administrative regions and geographic areas remain roughly comparable between 2002 and 2012. Indeed the Preliminary Census states: “when the overall patterns of distribution in 2012 were compared to that of 2002, the results indicate an identical pattern with only minor marginal differences.” The issues these raise cannot be properly addressed in this column, as further data and the in-depth analysis of the Final Report are required for this task.
Presently, much of the building stock is in Region 4 (39.4 per cent), Region 3 (16.3 per cent) and Region 6 (16.2 per cent). In 2012 the coastland area accounted for 91 per cent of the building stock compared to 91.8 per cent in 2002. The hinterland area accounts for 9 per cent of the building stock in 2012 compared to 8.2 per cent in 2002.
This concludes the discussion of the population bombshell started on August 3. I shall return to the topic when the Final Population and Housing Census Report for 2012 is released. It has been promised this would be available in a year’s time.