
My previous two columns showed that the overdraft or negative balance was used to finance the government’s large annual fiscal deficits. A debt ceiling was in place since 1994 and it is a mystery why the previous administration never bothered to increase the ceiling restraining the domestic debt. Take note of the fact that I wrote domestic debt, not foreign borrowing. It might be that they were concerned with the public’s reaction, but such an increase was not going to be difficult to justify given the favourable macroeconomic environment at the time. It should be noted that the Ali administration has increased the debt ceiling for both the domestic and foreign debt.
The two columns also noted that the overdraft, which is a form of money finance, was greater than the deficit for two years and as high as 88% in another. Interestingly, the Auditor General’s reports noted serious financial indiscretions for the same years when money finance exceeded and was exceedingly high relative to the fiscal deficit.
In today’s column, I want to explore where the overdraft funding went. The first chart, Figure 1, shows the number of central government employees from 2007 to 2018. I obtained this data from the Bureau of Statistics, which has not reported the numbers for 2019 and 2020. It was not clear whether this series includes contract workers. However, given the astounding increase in the size of central government employment, I want to believe these numbers do include contract employees as well. I made several enquiries in order to figure out the composition of the contract employees versus career civil servants, but no one answered. This data is top secret in Guyana.
Nevertheless, my view on Guyana’s modern political economy is probably known: politics is about winning the prize of government for allocating financial resources to political constituents and middlemen who financed the election campaign. The best engineering firms, for instance, are not chosen for public works nor are the best ideas and people with skills.
The necessity of rewarding the base dominates all other actions. In recent years, the PPP/C appears to be winning the public relations as it relates to reaching out beyond its East Indian base. Mr. Granger, who mobilized a historic alliance to win in 2015, allowed the ball to fall by depending on the AFC to maintain the East Indian support, a major miscalculation. It also shows that the PNC is incapable of thinking out of the box once it is in power.
Figure 1 is quite revealing. I start from 2007 to get a good enough period to compare several PPP/C years with the APNU+AFC period. In 2007, there were 8,711 central government employees. The number increased to 14,905 in 2015 when the PPP/C left office, thereby representing a 71.1% increase over that period.
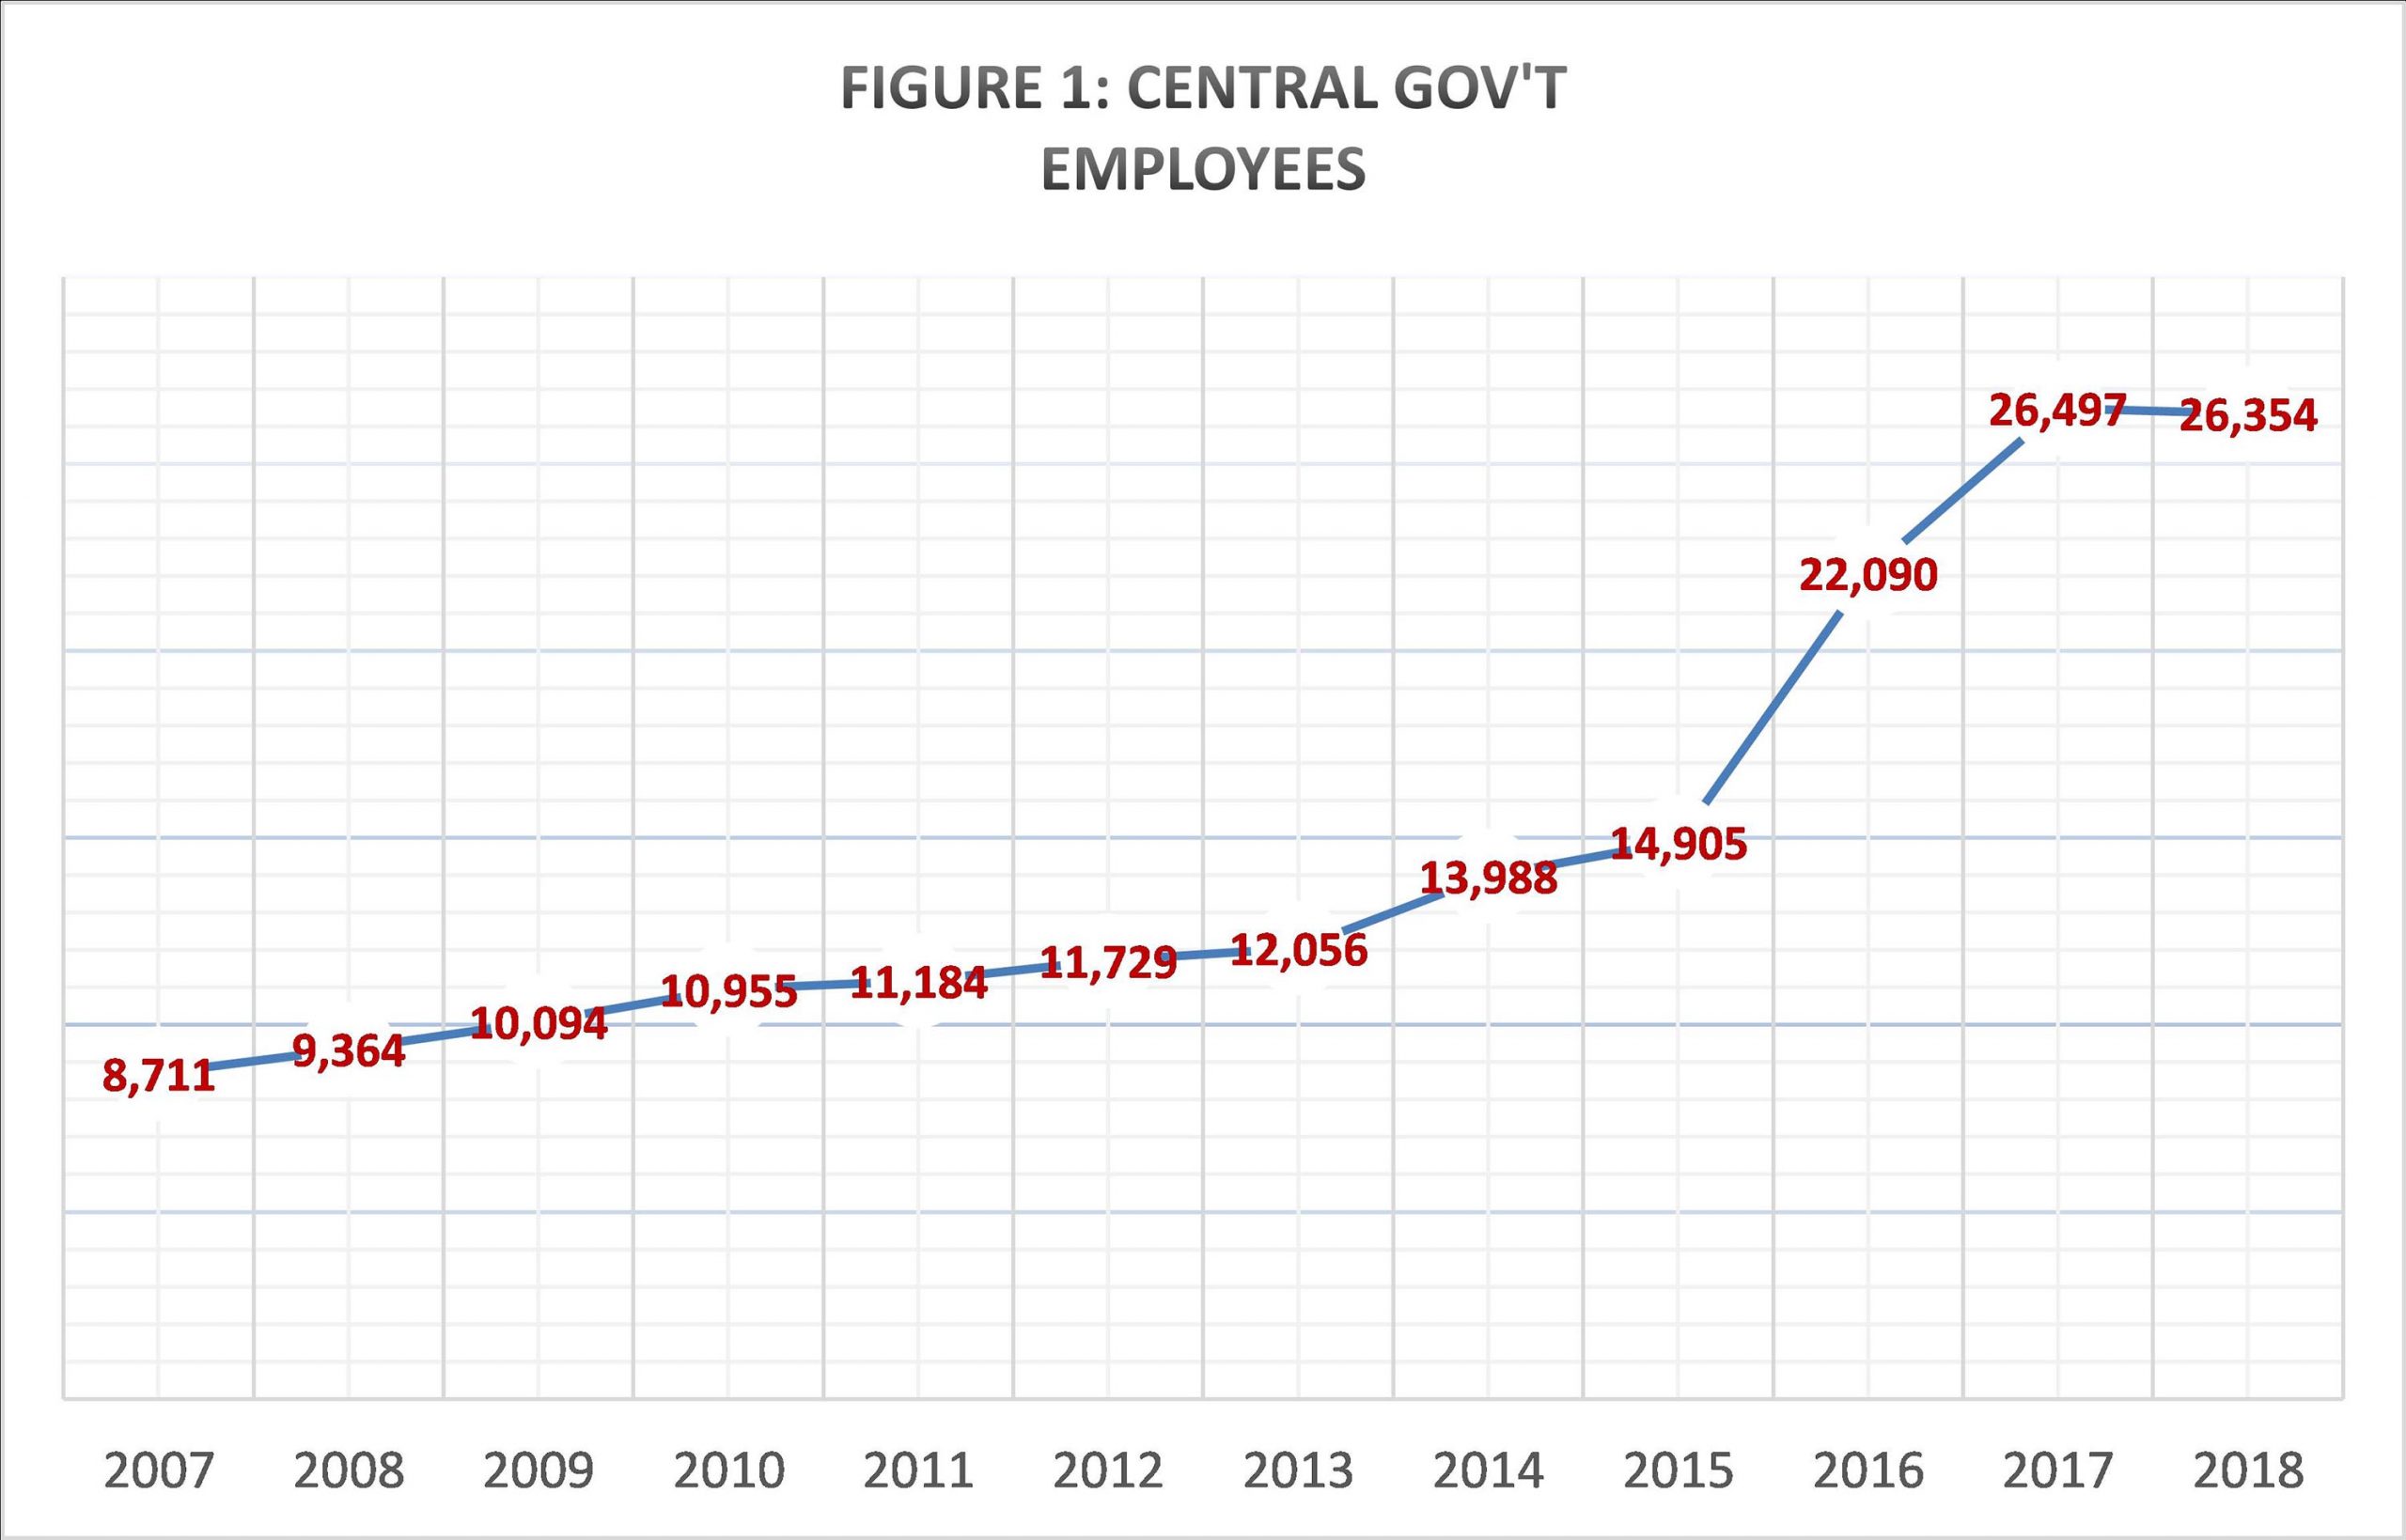
In 2018, the number was 26,354, indicating a 76.8% increase. It took the APNU+AFC regime just three years to get up to that number. It would be very interesting to know the 2019 and 2020 numbers. On the other hand, the PPP/C took eight years to increase the public service by 71.1%.
These numbers indicate how important the central government has become in employment. I also have the data for non-central government public sector employees (GuySuCo and the like), but I am not reporting them in a chart. In 2007, suffice to say, there were 18,370 such employees. That number declined by 40.3% to become 10,962 by 2018.
We cannot say for certain who are getting these jobs. However, it is fair to assume that the majority of the employment increase after a change in government went to supporters of the APNU+AFC. Similarly, during the long reign of the PPP/C, it is safe to assume that the majority went to their supporters. The public service is now a political battleground where suspicions, spying and possibly sabotage are rife. Standards were reduced to increase employment. One programme at UG removed the mathematics requirement. What an idea for the 21st Century! Remove maths and statistics but focus on buzz words and such things as how to use a knife and fork.
All of this implies that the building blocks of a developmental civil service are gone. There is no embeddedness and autonomy as in the South Korean, Japanese or even the Mauritian case. The Weberian bureaucracy is gone. It should be no surprise that projects are sub-optimally conceptualized, sequenced and implemented. Apparently, lowering electricity rates will cause a manufacturing take-off just like that.
Another major implication is that of redistribution. There are two aspects to distribution. First, there is income distribution. This tells us how the gross annual income, usually measured as GDP or Gross National Income (GNI), is distributed amongst the citizens of the country. Second, there is the issue of wealth (or asset) distribution. I cannot say anything about who owns the largest percentage of the stock of wealth given the data presented herein.
However, we can infer something about income distribution if we look at the public sector wage bill relative to GNI. I was able to obtain the annual public sector wage bill by extracting them from the budget Estimates, which is a document outlining central government’s budgeted and actual incomes and expenditures for a given year.
The first column in the table shows the percentage of government expenditure spent on wages, salaries and benefits. These numbers are striking because they show that most of government expenditure goes towards paying the wage bill. As most readers will agree, there is little left for capital expenditures such as critical infrastructure that are essential for promoting long-term development. The government wage bill out of expenditure was very high for the PPP/C periods, but got even higher during APNU+AFC.
The average for the entire period is 66.4%. For context, I also downloaded the same data for Barbados, Jamaica, and Trinidad and Tobago over the exact 2008 to 2020 period, as well as their respective GNI. The number was 33.8% for Jamaica and 23% for Barbados. Trinidad and Tobago came in with the lowest at 16.5%. Space does not allow me to explain my thoughts for the differences across the Caribbean. However, it is clear that Guyana’s average is higher than that of the other three CARICOM economies.
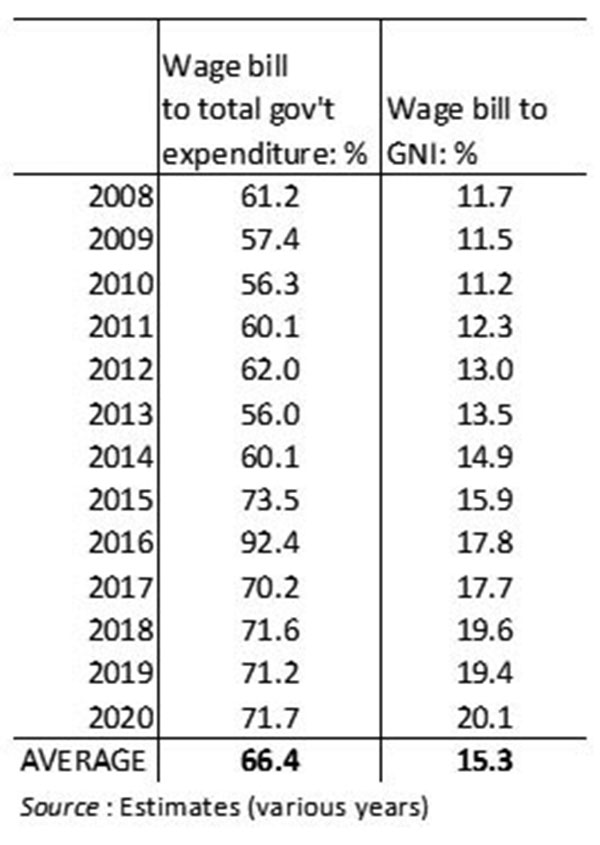
The other column in the table is very important for inference regarding the changing picture of income distribution in Guyana. As noted earlier, this wage bill (and benefits) excludes state-owned companies such as GuySuCo. It is clear from the table that the share of national income going to central government workers is increasing. Adding up the shares earned by all sectors must equal to 100%. Therefore, if public sector workers are earning a larger percentage over time, then all other Guyanese sectors combined must be getting a smaller share.
Of course, it would be better if we knew what the percentage of the total government wage bill was earned by the top 1% or earners, the top 5%, top 10%, top 20% and so on. But this is all a mystery. We have to work with the data we have. For now, the income shares are the best we can do.
Nevertheless, we can infer something else. The 15.9% of GNI earned for 2015 was shared by a smaller government workforce. The APNU+AFC took it up to 20.1% in 2020, at which time we can infer that this was shared with a much larger workforce. This is consistent, but does not prove, a running hypothesis of mine that the PPP/C’s redistributive patronage is more inequality-inducing compared with the PNC’s. However, the PPP/C is more likely eager to induce inequality-promoting redistribution amongst a relatively more multi-ethnic grouping. On the other hand, the Grangerian PNC was willing to induce relatively more egalitarian patronage amongst mainly one ethnic group. It means that a small number of East Indians, African Guyanese and other ethnicities benefit remarkably from the PPP/C’s largesse. The East Indian masses are big losers.
In closing, we should have one more essay on this issue. Then we move on to gas to shore.
Comments can be sent to: tkhemraj@ncf.edu