GASCI (www.gasci.com/telephone Nº 223-6175/6) reports that session 486’s trading results showed consideration of $4,802,161 from 66,627 shares traded in 9 transactions as compared to session 485 which showed consideration of $5,734,609 from 223,014 shares traded in 18 transactions. The stocks active this week were DIH, DBL and BTI.
Banks DIH Limited’s (DIH) four trades totalling 39,057 shares represented 58.62% of the total shares traded. DIH’s shares were traded at a Mean Weighted Average Price (MWAP) of $16.8, which showed an increase of $0.5 from its previous close of $16.3. DIH’s trades contributed 13.66% ($656,158) of the total consideration. All of DIH’s trades were at $16.8.
 Demerara Bank Limited’s (DBL) two trades totalling 19,570 shares represented 29.37% of the total shares traded. DBL’s shares were traded at a MWAP of $27.9, which showed a decrease of $0.1 from its previous close of $28.0. DBL’s trades contributed 11.37% ($546,003) of the total consideration. Both of DBL’s trades were at $27.9.
Guyana Bank for Trade and Industry Limited’s (BTI) three trades totalling 8,000 shares represented 12.01% of the total shares traded. BTI’s shares were traded at a MWAP of $450.0, which showed a decrease of $50.0 from its previous close of $500.0. BTI’s trades contributed 74.97% ($3,600,000) of the total consideration. All of BTI’s trades were at $450.0.
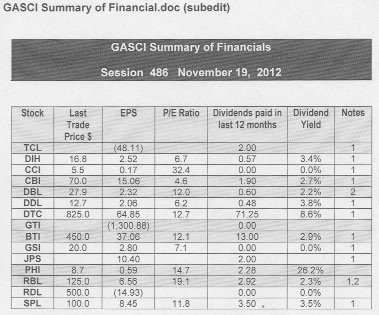
NOTES:
Best bid: The highest price that a buyer is willing to pay for a security.
Best offer: The lowest price at which a seller is offering to sell securities.
Notes
1 – Interim Results
2 – Prospective Dividends
3 – Shows year-end EPS but Interim Dividend
 EPS: earnings per share for a 12-month period to the date the latest financials have been prepared. These include:
2005 – Final results for GTI.
2008 – Final results for PHI.
2011 – Final results for RDL.
2012 – Interim results for TCL, DIH, CCI, CBI, DDL, DTC, BTI, GSI, JPS, RBL and SPL.
2012 – Final results for DBL.
As such, some of these EPS calculations are based on un-audited figures.
P/E Ratio: Price/Earnings Ratio = Last Trade Price/EPS
Dividend yield = Dividends paid in the last 12 months/last trade price.