Continued
Cost control
Last week, it was observed that though GNPL was experiencing significant difficulties, its management was making the best of a bad situation. This week an analysis using the Strategic Profit Model (SPM) helps to reveal that, with no expectation of new money, cost control was the only survival tactic available to the company, and that that business strategy seems to have worked for a while. The SPM is similar to the DuPont Identity used to measure operational efficiency and resource performance. The SPM therefore brings together information from the balance sheet and the income statement and enables one to link financial performance with the contribution of customers. The SPM also helps with understanding the financial relationship between resources under the control of management and external parties. The additional usefulness of this model is that it gives the public a chance to assess GNPL’s contribution to government revenues. This latter point is important given that GNPL is a public enterprise that is judged on whether it contributes positively to the revenues of government or whether it is a burden on the national treasury.
Overall, the SPM “emphasizes management’s responsibility for generating a return on the shareholders’ investment.” The shareholders in this case are the taxpayers of Guyana who are represented by the government. Assessing GNPL’s performance through the SPM model helps to indicate if it is demonstrating substantive accountability to the people of Guyana.
Margin management
 One of the ways in which this could be done is by looking at the margin management over the years 2002 to 2011. The focus on gross profit margin has three benefits. First, for a company that has been on the chopping block for an eternity, the focus on its ability to manage its production operations is important. The size of that margin could determine if the company should stay open or if it should be forced to shut down. There is no magic number, but to avoid disappearing, the gross margin must be sufficient to cover all other expenses incurred and then add to the assets of the business. From the point of view of the economist, that must occur when marginal revenue exceeds average cost. Second, it avoids income distortion that could arise from a legitimate application of accounting rules. An example of that risk comes from non-income generating events as was the case in 2008 when a revaluation of assets helped the company report additional income of $22 million. Not only did this event help GNPL report a profit when it should have reported substantial losses stemming from its operations, but it caused it to have an income tax liability for that year when it should have had none. The third value of examining gross margins is that it aids in determining the contribution that the company makes to gross domestic product (GDP).
Table 2 below contains data on the behaviour of the gross profit margin of GNPL. Before discussing the impact of that data, it should be pointed out that there were at least two events with significant consequences for the company during the period under discussion. In 2004, the company had a massive retrenchment exercise that resulted in significant impact on its direct labour costs through the granting of severance pay to the workers who were released. In that year, the company’s gross margin dropped steeply to 12 per cent from a level of 21 per cent in the prior year. The other event was more favourable to the company as a result of a special demand by the Guyana Elections Commission (Gecom) that 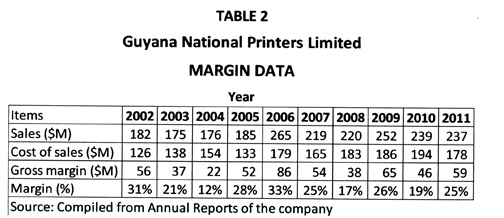 helped to push sales up in 2006 by 44 per cent. As a result, the company’s gross margin climbed 33 per cent over the level attained in 2005. Despite the two events with contrasting consequences, GNPL was able to keep gross margins above 20 per cent of sales 7 out of 10 times. In fact, the company maintained an average of 24 per cent in its gross profit margin over the 10-year period. Despite a trend of reasonable gross margins, there is some evidence that GNPL is having trouble with its customers.
Customer financing
Unlike the sound of its name, the gross profit margin tells one nothing about profitability of the company. The issue of profitability is best understood in the context of the performance of the money invested and arises from the performance of the assets of the company. The gross profit margin on the other hand tells of the relationship between the customers of GNPL and their willingness to keep financing its operations. That relationship is also important to the profitability of the company and will be used to conclude this article.
As one would notice from Table 2 above, the gross profit margin declined from 31 per cent of sales in 2002 to 25 per cent of sales in 2011. This is largely because revenues have grown slower than direct production costs. Sales grew at three per cent from 2002 to 2011 while direct production costs grew at a rate of four per cent per annum. The consequence of its inability to retain margins at the 2002 level is that GNPL lost $14 million in sales in 2011. One could see that, with the exception of 2006, the company would have lost an average of $50 million over the period in review stemming from a combination of higher employment costs, machine downtime and higher prices for raw materials. Any loss in revenue always consists of an income and a substitution effect. Given that output of the company grew at an average of one per cent during the period, the loss in revenue suggests that GNPL was forced also to reduce prices to remain in the market. This is no doubt a result of the loss of its monopoly on government contracts and the emergence of several competitors in the printing industry.
Profitability
The issue of GNPL’s profitability could be examined in the context of the four variables shown in Table 3 below.

The net profit margin derives from the overall use of assets that were made possible by the contribution of customers. Out of every $1 received from customers, GNPL was able to keep 10 cents in 2002. By 2011, it was barely keeping two cents. With customers contributing $1.10 for every $1 of assets used, GNPL was able to generate 11 cents in profits in 2002. That is shown by the return on assets. By 2011, it was getting three cents. As a result, the money invested by taxpayers earned 37 cents for every $1 in 2002 and four cents in 2011. The attractive performance of 2002 was possible because the company was able to leverage the money that it got from its customers as advance payments on jobs, its trade creditors and taxpayers. GNPL’s performance looks worse from 2008 where tax disputes over the company’s assets finally took a toll on its capacity and its ability to take advantage of money from external parties. In addition, as the figures on net profit margin, return on assets and financial leverage show, the company is having a hard time keeping costs under control, making good use of its assets and is struggling to keep its customers satisfied.
Conclusion
As GNPL approaches its 75th Anniversary, the revaluation of its assets has not helped its survival as a public enterprise. While the revaluation increases the value of the company and allows it to command a higher selling price, it masks the reality that the company is still operating with uncompetitive technology. This is a likely reason that operating costs are consuming a larger share of sales revenue. With an increasing operating cost to revenue ratio, GNPL is at risk of losing competitive advantage further and has the sword of Damocles hanging over its head.
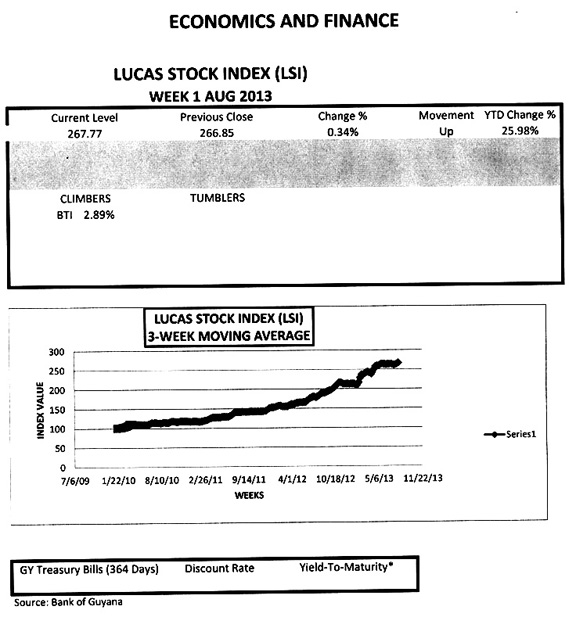
LUCAS STOCK INDEX
The Lucas Stock Index (LSI) increased slightly by 0.34 percent in trading during the first week of August 2013. Trading involved four companies in the LSI with a total of 53,800 shares in the index changing hands this week. There was one Climber while the stocks of the other three companies recorded no change in value. The lone Climber was Guyana Bank for Trade and Industry (BTI) which rose 2.89 percent on the trade of 2,200 shares. The three companies with no change in value were Banks DIH (DIH) which sold 18,100 shares, Demerara Bank Limited (DBL) which sold 32,500 shares and Demerara Tobacco Company (DTC) which sold 1,000 shares.